
ANOVA+tukey中带有multcompView包和multcompLetters4函数的错误字母
ANOVA+tukey中带有multcompView包和multcompLetters4函数的错误字母
提问于 2022-01-26 13:39:58
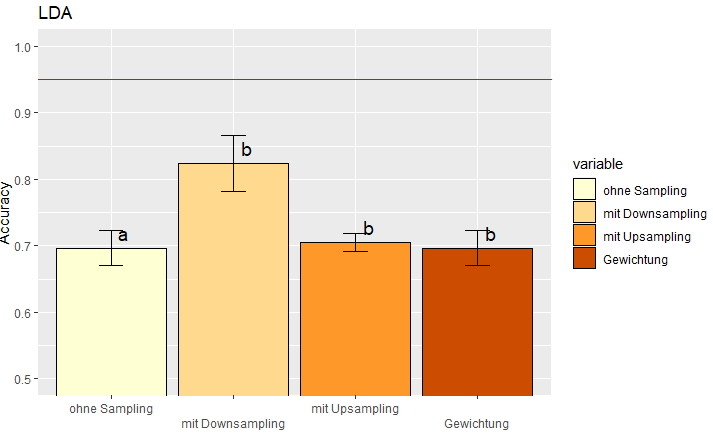
我试图想象我的统计指标的方差和后特制图基在一个酒吧。到目前为止,这已经解决了,但我的信件的顺序是错误的,“麻省理工学院抽样”(2)应该是一个区别于其他人,而不是第一个"ohne抽样“。
我使用的代码:
library(ggplot2)
library(multcompView)
library(reshape2)
a.lda <- read.table(header = TRUE, text = "  rowname ohne_Sampling mit_Downsampling mit_Upsampling Gewichtung
                          1   Fold1     0.6732673        0.8390805      0.7192982  0.6732673
                          2   Fold2     0.7227723        0.8181818      0.7105263  0.7227723
                          3   Fold3     0.7100000        0.7586207      0.6842105  0.7100000
                          4   Fold4     0.6633663        0.8295455      0.7105263  0.6633663
                          5   Fold5     0.7128713        0.8750000      0.7017544  0.7128713")

#Transformation of the dataframe to get a format ggplot2 is able to use
a.lda <- melt(a.lda, id.vars="rowname")

#data_summary Function
data_summary <- function(data, varname, groupnames){
  require(plyr)
  summary_func <- function(x, col){
    c(mean = mean(x[[col]], na.rm=TRUE),
      sd = sd(x[[col]], na.rm=TRUE),
      minimum = min(x[[col]], na.rm=TRUE))
  }
  data_sum<-ddply(data, groupnames, .fun=summary_func,
                  varname)
  data_sum <- rename(data_sum, c("mean" = varname))
  return(data_sum)
}

a.sd.lda <- data_summary(a.lda, varname = "value", groupnames = "variable")

#ANOVA+Tuckey
a.anova <- aov(data=a.lda, value ~ variable)
tukey <- TukeyHSD(a.anova)
cld <- as.data.frame.list((multcompLetters4(a.anova,tukey))$variable)
#The wrong letters do already appear here
a.sd.lda$cld <- cld$Letters因此,通过检查a.sd.lda表,人们已经可以看到错误的字母a,b,a而不是a,b,a,a。同时,通过检查tukey结果,ohne抽样、mit更新抽样和Gewichtung之间没有显著差异。所以我猜multcompLetters4()函数导致了无序。
我会非常感谢任何建议!
在寻找答案时,我发现了这个堆栈溢出条目(R multcompView包中错误的键-字母排序),但是没有一个答案解决了我的问题。
只是为了总结一下,这是可视化的代码,尽管我的代码中的错误必须在上面。
#Visualization
ldaplot <- ggplot(a.sd.lda, aes(variable,value,fill=variable))+
      labs(title="LDA")+
      scale_x_discrete(guide = guide_axis(n.dodge=2))+
      coord_cartesian(ylim=c(y_min,1))+
      geom_bar(stat="identity", color="black",
               position=position_dodge()) +
      scale_fill_brewer(palette="YlOrBr")+
      geom_text(data = a.sd.lda, aes(x = variable, y = value, label = cld), size = 5, vjust=-.5, hjust=-.7)+
      geom_errorbar(aes(ymin=value-sd, ymax=value+sd), width=.2,
                    position=position_dodge(.9))+
      labs(x="", y="Accuracy")+
geom_abline(aes(intercept=Akzeptanzwert,slope=0), color="red")multcompLetter4()函数和相关函数的源代码可在这里获得:https://rdrr.io/cran/multcompView/f/
回答 1
Stack Overflow用户
发布于 2022-01-27 08:47:41
好的,在尝试了很多之后,我找到了通过另一个包来解决这个问题的方法:
multcomp
下面是我的代码,以获得正确的结果和绘图:
library(ggplot2)
library(multcomp)
library(reshape2)


a.lda <- read.table(header = TRUE, text = "  rowname ohne_Sampling mit_Downsampling mit_Upsampling Gewichtung
                          1   Fold1     0.6732673        0.8390805      0.7192982  0.6732673
                          2   Fold2     0.7227723        0.8181818      0.7105263  0.7227723
                          3   Fold3     0.7100000        0.7586207      0.6842105  0.7100000
                          4   Fold4     0.6633663        0.8295455      0.7105263  0.6633663
                          5   Fold5     0.7128713        0.8750000      0.7017544  0.7128713")

#Transformation of the dataframe to get a format ggplot2 is able to use
a.lda <- melt(a.lda, id.vars="rowname")

#data_summary Function
data_summary <- function(data, varname, groupnames){
  require(plyr)
  summary_func <- function(x, col){
    c(mean = mean(x[[col]], na.rm=TRUE),
      sd = sd(x[[col]], na.rm=TRUE),
      minimum = min(x[[col]], na.rm=TRUE))
  }
  data_sum<-ddply(data, groupnames, .fun=summary_func,
                  varname)
  data_sum <- rename(data_sum, c("mean" = varname))
  return(data_sum)
}

a.sd.lda <- data_summary(a.lda, varname = "value", groupnames = "variable")


#ANOVA+Tuckey **NEW**
a.anova <- aov(data=a.lda, value ~ variable)
tukey <- glht(a.anova, linfct = mcp(variable = "Tukey"))
tuk.cld <- cld(tukey)
a.sd.lda$cld <- tuk.cld$mcletters$Letters

#Visualization
ldaplot <- ggplot(a.sd.lda, aes(variable,value,fill=variable))+
  labs(title="LDA")+
  scale_x_discrete(guide = guide_axis(n.dodge=2))+
  coord_cartesian(ylim=c(y_min,1))+
  geom_bar(stat="identity", color="black",
           position=position_dodge()) +
  scale_fill_brewer(palette="YlOrBr")+
  geom_text(data = a.sd.lda, aes(x = variable, y = value, label = cld), size = 5, vjust=-.5, hjust=-.7)+
  geom_errorbar(aes(ymin=value-sd, ymax=value+sd), width=.2,
                position=position_dodge(.9))+
  labs(x="", y="Accuracy")+
geom_abline(aes(intercept=Akzeptanzwert,slope=0), color="red")希望它也能帮助其他R-用户:)
页面原文内容由Stack Overflow提供。腾讯云小微IT领域专用引擎提供翻译支持
原文链接:
https://stackoverflow.com/questions/70864332
复制相关文章
相似问题
腾讯云开发者

Copyright © 2013 - 2026 Tencent Cloud. All Rights Reserved. 腾讯云 版权所有
深圳市腾讯计算机系统有限公司 ICP备案/许可证号:粤B2-20090059 ![]() 粤公网安备44030502008569号
粤公网安备44030502008569号
腾讯云计算(北京)有限责任公司 京ICP证150476号 | 京ICP备11018762号