脚本更新--高精度空转分析差异富集的细胞生态位
原创
脚本更新--高精度空转分析差异富集的细胞生态位
原创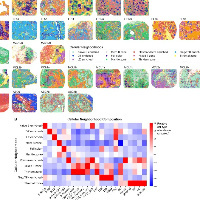
追风少年i
发布于 2026-03-06 10:06:42
发布于 2026-03-06 10:06:42
作者,Evil Genius
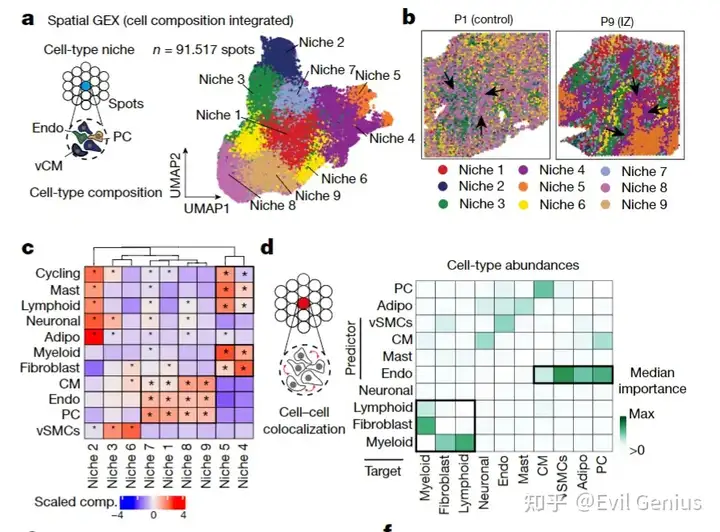
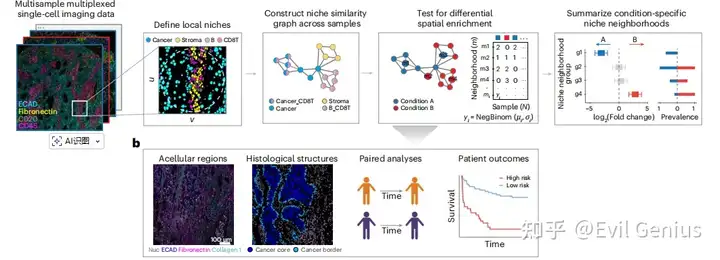
关于空间转录组的niche分析,相信大家都已经不陌生了,那么针对特定的组织结构,其区域显著富集的细胞niche,以及不同组(疾病间)显著差异的细胞niche,将会是分析的一个重点。
低精度如下面的分析
niche5明显聚集在P9样本。
高精度则需要更加的精细化
组织之间,不同区域之间,不同组之间的细胞结构需要更加小心的处理,发现其中niche的细微变化。
整体思路
今天我们来分享一下这部分代码,前期的处理需要大家完成。
import os
import pandas as pd
import numpy as np
import quiche as qu
import scanpy as sc
import anndata
%reload_ext autoreload
%load_ext autoreload
%autoreload 2
%matplotlib inline

sc.set_figure_params(dpi = 400, dpi_save = 400, fontsize = 14)

####读取数据
adata = anndata.read_h5ad('多样本整合的h5ad')

adata.obs['Relapse'] = adata.obs['Relapse'].astype('int').astype('str')
adata.obs['Study'] = adata.obs['Study'].map(dict(zip(adata.obs['Study'].cat.categories,['A', 'B', 'C', 'D', 'E'])))

adata.raw = adata
adata.X = qu.pp.standardize(adata.X)

## Removes FOVs that are less than the downsampling (i.e. sketch) size
sketch_size = 1000
adata  = qu.pp.filter_fovs(adata, 'Patient_ID', sketch_size)
Perform differential spatial enrichment analysis with QUICHE
### initialize class
quiche_op = qu.tl.QUICHE(adata = adata, labels_key = 'cell_cluster', spatial_key = 'spatial', fov_key = 'fov', patient_key = 'Patient_ID', segmentation_label_key = 'label')
### step 1: compute spatial niches
## in this case we are computing a knn of 30 neighbors bounded by 200 pixel radius
quiche_op.compute_spatial_niches(radius = 200, n_neighbors = 30, min_cell_threshold = 3)
### step 2: perform distribution-focused downsampling by sampling niches from each patient according to the sketch size parameter
quiche_op.subsample(sketch_size = sketch_size, sketch_key = 'Patient_ID', n_jobs = 8)
### step 3: test for differential spatial enrichment across conditions.
## in this case, we are testing for differential enrichment across relapse groups while adjusting for medical center (i.e. study)
## for more details on model contrasts, see edgeR documentation
quiche_op.differential_enrichment(design = '~Study+Relapse', model_contrasts = 'Relapse1', k_sim = 100)
### step 4: annotate niche neighborhoods by the most abundant cell types
## in this case, annotate by the top 3
quiche_op.annotate_niches(nlargest = 3, annotation_scheme = 'neighborhood', annotation_key = 'quiche_niche_neighborhood')

###Access significant niche neighborhoods
## aggregates and returns 'significant' annotated niche neighborhoods
## in this case, we are filtering to ensure niches have median logFC > 1 or < -1 and have median Spatial FDR < 0.05
## feel free to intially relax your thresholds when examining results to ensure you're not missing information based on too strict of cutoffs
niche_scores = qu.tl.filter_niches(quiche_op,
                                   thresholds = {'logFC': {'median' : [-1, 1]}, 'SpatialFDR': {'median' : 0.05}},
                                   min_niche_count = 5,
                                   annotation_key = 'quiche_niche_neighborhood')

niche_scores.sort_values(by = 'logFC').head()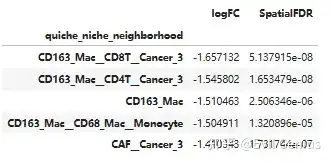
## computes summary statistics
niche_metadata = qu.tl.compute_niche_metadata(quiche_op,
                                            niches = list(niche_scores.index),
                                            annotation_key = 'quiche_niche_neighborhood',
                                            patient_key = 'Patient_ID',
                                            condition_key = 'Relapse',
                                            niche_threshold = 0,
                                            condition_type  = 'binary',
                                            metrics = ['logFC', 'SpatialFDR', 'PValue'])

niche_metadata.head()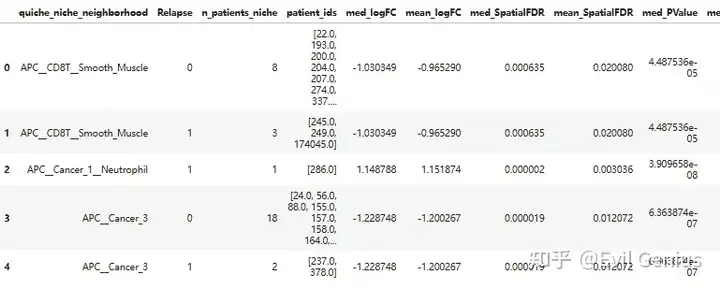
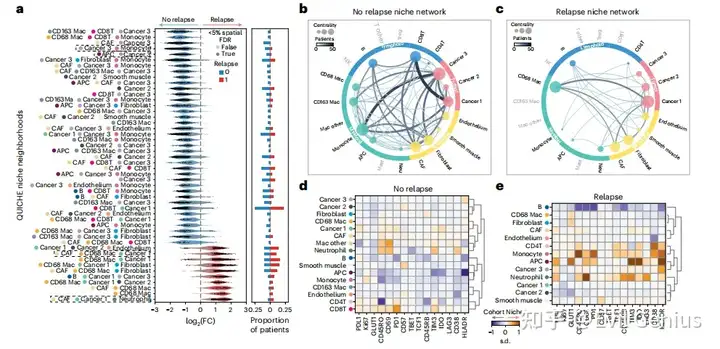
Plot significant niche neighborhoods of interest
qu.pl.beeswarm_proportion(quiche_op,
                 niche_metadata = niche_metadata,
                niches = niche_scores.index,
                xlim = [-3,3],
                xlim_proportion = [-0.3, 0.3],
                logfc_key = 'logFC',
                pvalue_key = 'SpatialFDR',
                annotation_key = 'quiche_niche_neighborhood',
                condition_key = 'Relapse',
                figsize = (6, 12),
                fontsize = 10,
                colors_dict = {'0': '#377eb8', '1': '#e41a1c'},
                save_directory = None,
                filename_save = None)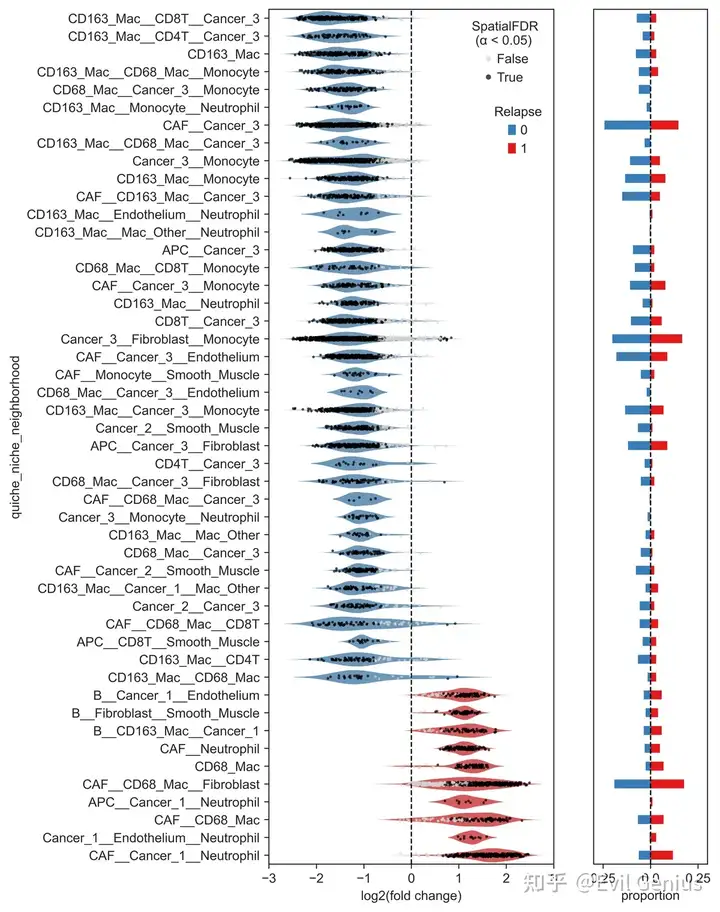
niche网络
lineage_dict = {'APC':'myeloid', 'B':'lymphoid', 'CAF': 'structural', 'CD4T': 'lymphoid', 'CD8T': 'lymphoid',
                'CD68_Mac': 'myeloid', 'CD163_Mac': 'myeloid', 'Cancer_1': 'tumor', 'Cancer_2': 'tumor', 'Cancer_3': 'tumor',
                'Endothelium':'structural', 'Fibroblast': 'structural', 'Mac_Other': 'myeloid', 'Mast':'myeloid', 'Monocyte':'myeloid',
                'NK':'lymphoid', 'Neutrophil':'myeloid', 'Smooth_Muscle':'structural', 'T_Other':'lymphoid', 'Treg':'lymphoid'}

cell_ordering = ['Cancer_1', 'Cancer_2', 'Cancer_3', 'CD4T', 'CD8T', 'Treg', 'T_Other', 'B',
                 'NK', 'CD68_Mac', 'CD163_Mac', 'Mac_Other', 'Monocyte', 'APC','Mast', 'Neutrophil',
                 'CAF', 'Fibroblast', 'Smooth_Muscle', 'Endothelium']

##niche network for patients that did not relapse, ie logFC < 0
niche_metadata_neg = niche_metadata[(niche_metadata['mean_logFC'] < 0) & (niche_metadata['n_patients_niche'] > 1)]
G1 = qu.tl.compute_niche_network(niche_df = niche_metadata_neg,
                          colors_dict = colors_dict,
                          lineage_dict = lineage_dict,
                          annotation_key = 'quiche_niche_neighborhood')

qu.pl.plot_niche_network_donut(G = G1,
                               figsize=(6, 6),
                               node_order = cell_ordering,
                               centrality_measure = 'eigenvector',
                               colors_dict = colors_dict,
                               lineage_dict=lineage_dict,
                               donut_radius_inner = 1.15,
                               donut_radius_outer = 1.25,
                               edge_cmap = 'bone_r',
                               edge_label = 'Patients',
                               save_directory=None,
                               filename_save=None)

##niche network for patients that relapsed, ie logFC > 0
niche_metadata_pos = niche_metadata[(niche_metadata['mean_logFC'] > 0) & (niche_metadata['n_patients_niche'] > 1)]
G2 = qu.tl.compute_niche_network(niche_df = niche_metadata_pos,
                          colors_dict = colors_dict,
                          lineage_dict = lineage_dict,
                          annotation_key = 'quiche_niche_neighborhood')

qu.pl.plot_niche_network_donut(G = G2,
                               figsize=(6, 6),
                               node_order = cell_ordering,
                               centrality_measure = 'eigenvector',
                               colors_dict = colors_dict,
                               lineage_dict=lineage_dict,
                               donut_radius_inner = 1.15,
                               donut_radius_outer = 1.25,
                               edge_cmap = 'bone_r',
                               edge_label = 'Patients',
                               save_directory=None,
                               filename_save=None)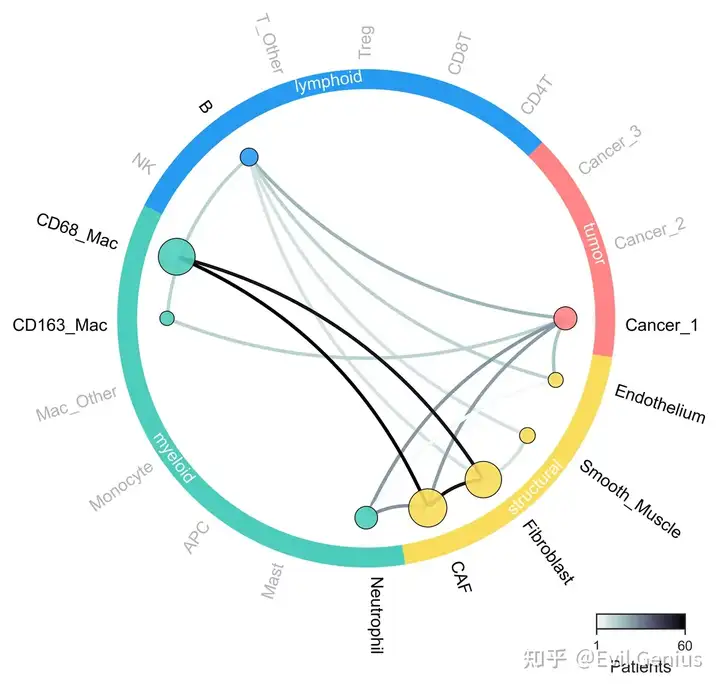
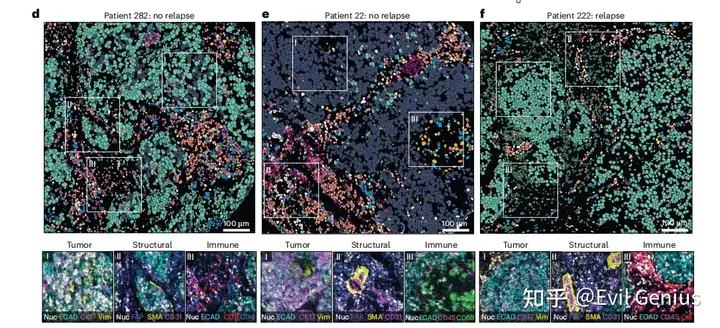
niche的空间展示
niche = 'CD8T__Cancer_1'
seg_dir = './'

qu.pl.plot_niches(quiche_op,
                  niche = niche,
                  fovs = ['TMA44_R14C7'],
                  segmentation_directory = seg_dir,
                  save_directory = os.path.join('figures', 'quiche_niche_neighborhood'),
                  fov_key = "fov",
                  segmentation_label_key  = "label",
                  labels_key='cell_cluster',
                  annotation_key = "quiche_niche_neighborhood",
                  seg_suffix = "_whole_cell.tiff",
                  colors_dict = {'Cancer_1': '#66cdaa', 'CD8T': '#ff5666'},
                  figsize = (6, 6),
                  dpi = 300)
qu.pl.plot_niche_scores(quiche_op,
                        niche = niche,
                        fovs = ['TMA44_R14C7'],
                        segmentation_directory = seg_dir,
                        save_directory = os.path.join('figures', 'logFC'),
                        fov_key = "fov",
                        segmentation_label_key  = "label",
                        labels_key='cell_cluster',
                        annotation_key = "quiche_niche_neighborhood",
                        metric = "logFC",
                        seg_suffix = "_whole_cell.tiff",
                        vmin  = None,
                        vmax = None,
                        cmap = "vlag",
                        figsize = (6, 6),
                        dpi = 300)

qu.pl.plot_niche_scores(quiche_op,
                        niche = niche,
                        fovs = ['TMA44_R14C7'],
                        segmentation_directory = seg_dir,
                        save_directory = os.path.join('figures', '-log10(SpatialFDR)'),
                        fov_key = "fov",
                        segmentation_label_key  = "label",
                        labels_key='cell_cluster',
                        annotation_key = "quiche_niche_neighborhood",
                        metric = "-log10(SpatialFDR)",
                        seg_suffix = "_whole_cell.tiff",
                        vmin  = None,
                        vmax = None,
                        cmap = "Reds",
                        figsize = (6, 6),
                        dpi = 300)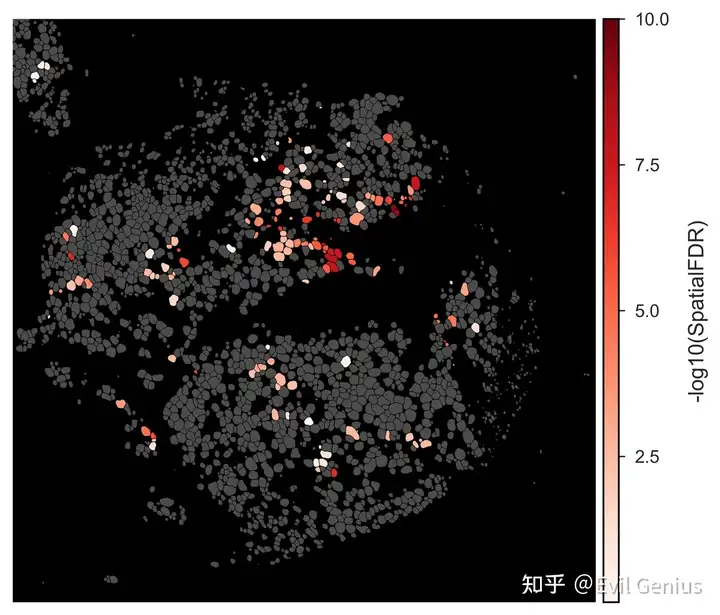
差异niche分析
functional_markers = ['PDL1', 'Ki67', 'GLUT1', 'CD45RO', 'CD69', 'PD1', 'CD57', 'TBET', 'TCF1', 'CD45RB', 'TIM3', 'IDO', 'LAG3', 'CD38', 'HLADR']
quiche_op.compute_functional_expression(niches=niche_scores.index,
                                        annotation_key = 'quiche_niche_neighborhood',
                                        min_cell_threshold = 3,
                                        foldchange_key = 'logFC',
                                        markers = functional_markers,
                                        n_jobs = 8)

qu.pl.plot_differential_expression(quiche_op,
                            niches = np.unique(niche_metadata_neg.quiche_niche_neighborhood),
                            annotation_key = 'quiche_niche_neighborhood',
                            labels_key = 'cell_cluster',
                            markers = functional_markers,
                            figsize = (5.25, 4.5),
                            cmap = 'vlag',
                            save_directory = 'figures',
                            filename_save = 'matrixplot')

qu.pl.plot_differential_expression(quiche_op,
                            niches = np.unique(niche_metadata_pos.quiche_niche_neighborhood),
                            annotation_key = 'quiche_niche_neighborhood',
                            labels_key = 'cell_cluster',
                            markers = functional_markers,
                            figsize = (5.25, 4),
                            cmap = 'vlag',
                            vmin = -1,
                            vmax = 1,
                            vcenter = 0,
                            dendrogram = True,
                            save_directory = 'figures',
                            filename_save = 'matrixplot')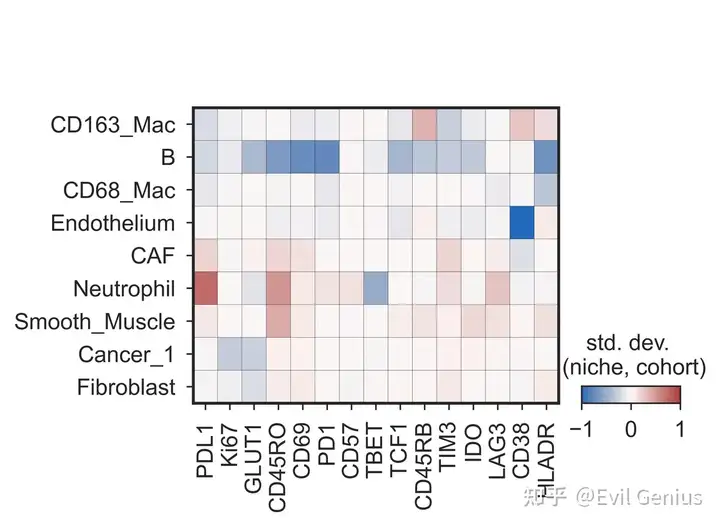
生活很好,有你更好。
原创声明:本文系作者授权腾讯云开发者社区发表,未经许可,不得转载。
如有侵权,请联系 cloudcommunity@tencent.com 删除。
原创声明:本文系作者授权腾讯云开发者社区发表,未经许可,不得转载。
如有侵权,请联系 cloudcommunity@tencent.com 删除。
评论
登录后参与评论
推荐阅读
目录
腾讯云开发者

Copyright © 2013 - 2026 Tencent Cloud. All Rights Reserved. 腾讯云 版权所有
深圳市腾讯计算机系统有限公司 ICP备案/许可证号:粤B2-20090059 ![]() 粤公网安备44030502008569号
粤公网安备44030502008569号
腾讯云计算(北京)有限责任公司 京ICP证150476号 | 京ICP备11018762号