
如何将fft点重新标度以得到与解析解相同的结果?
我想用numpy fft包进行快速傅里叶变换,然后我尝试比较解析解和快速傅里叶变换的结果,虽然我可以从我所做的图中看到曲线是相似的,但很明显,尺度是不同的。
我尝试过几种不同版本的频率(角频率、频率和波数),但我的所有尝试都没有奏效,在numpy文档中,还不清楚如何准确地定义快速傅里叶变换。例如,我想用指数函数在时间上变换成角频域,f(t)=Exp(-a|t|),F(w)=a/pi*(a²+w²) (这个解析解有多个版本,取决于我们考虑的频率空间)
def e(t):
    return np.exp(-0.5*abs(t))
def F(w):
    return 0.5/(np.pi)*(1/(((0.5)**2)+((w)**2)))

t=np.linspace(0,100,1000)

w=np.fft.fftfreq(len(t))
plt.plot(w,F(w),'o',label='F(w)')
plt.legend()
plt.show()

fourier=np.fft.fft(e(t))
plt.plot(w,fourier,'o')
plt.show()
我尝试了以上代码的多个不同的变体,特别是频率,但我仍然没有达到一点,fft和解析解是相似的。有人能帮帮我吗?
回答 1
Stack Overflow用户
发布于 2019-04-04 19:32:47
傅里叶变换可应用于可积函数(如np.exp(-0.5*abs(t)) )。但是离散傅里叶变换计算周期信号的傅里叶变换。见https://dsp.stackexchange.com/questions/26884/about-fourier-transform-of-periodic-signal和FFTW真正计算的是。
因此,--长度为T的帧的DFT对应于周期化帧的傅里叶变换,自该帧从0开始,计算周期右侧指数衰减的傅里叶变换:
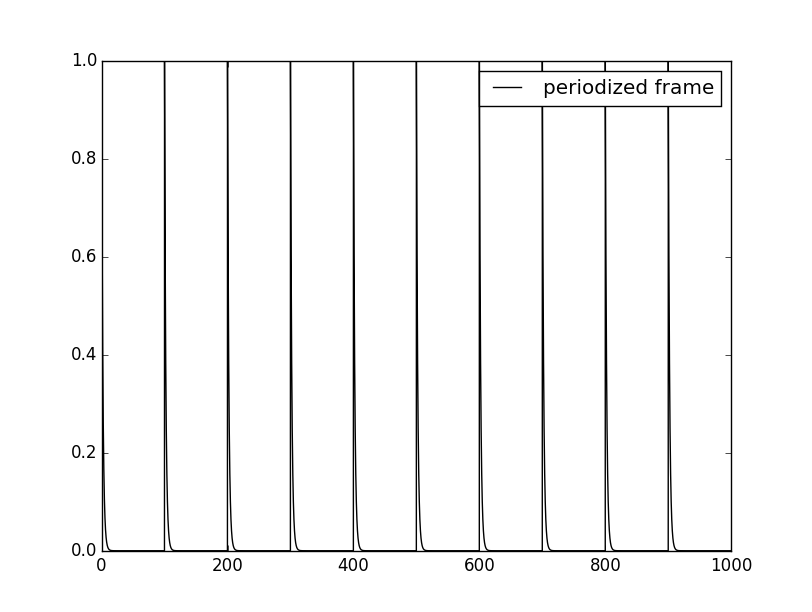
正如您所看到的,np.exp(-0.5*abs(t)) 函数的一半没有显示。,让我们纠正它,并添加双面指数衰减的周期化增长部分。我使用频率作为参数:
import matplotlib.pyplot as plt
import numpy as np
def e(t):
return np.exp(-0.5*abs(t))
def F(w):
return 0.5/(np.pi)*(1/(((0.5)**2)+((w)**2)))
def Fc(xi):
#ok , that's sourced from https://en.wikipedia.org/wiki/Fourier_transform ... Square-integrable functions, one-dimensional, line 207
return 2*0.5/(((0.5)**2)+(4*(np.pi*xi)**2))
framelength=100.
nbsample=1000
def ep(t):
#the periodized negative part is added at the end of the frame.
return np.maximum(np.exp(-0.5*abs(t)),np.exp(-0.5*abs(t-framelength)))
t=np.linspace(0,framelength,nbsample, endpoint=False)
#plotting the periodized signal, to see what's happening
ein=ep(t)
tp=np.linspace(0,10*framelength,10*nbsample, endpoint=False)
periodized=np.zeros(10*nbsample)
for i in range(10):
for j in range(nbsample):
periodized[i*nbsample+j]=ein[j]
plt.plot(tp,periodized,'k-',label='periodized frame')
plt.legend()
plt.show()
fourier=np.fft.fft(ep(t))/np.size(ep(t))*framelength
#comparing the mean is useful to check the overall scaling
print np.mean(ep(t))*framelength
print fourier[0]
print Fc(0)
#the frenquencies of the DFT of a frame of length T are 1/T, 2/T ... and negative for the second part of the array.
xi=np.fft.fftfreq(len(t), framelength/len(t))
# comparison between analytical Fourier transform and dft.
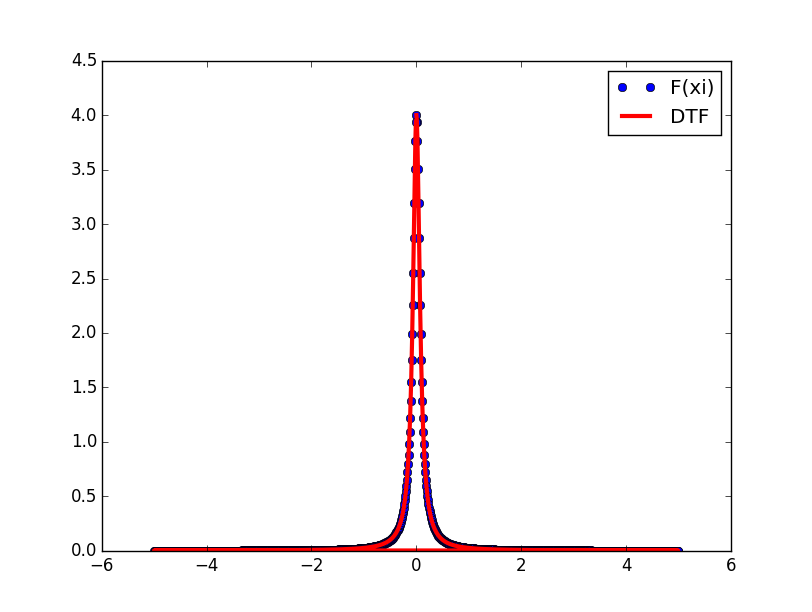
plt.plot(xi,Fc(xi),'o',label='F(xi)')
plt.plot(xi,np.real(fourier),'k-', lw=3, color='red', label='DTF')
plt.legend()
plt.show()结果是:
对于实验中的非周期信号,当帧被周期化时,会出现人为的不连续.通过引入光谱泄漏和视窗来减弱不连续性及其影响。其中一个潜在的窗口,称为泊松窗口,是一个双面指数衰减!
https://stackoverflow.com/questions/55519419
复制相似问题
腾讯云开发者

Copyright © 2013 - 2026 Tencent Cloud. All Rights Reserved. 腾讯云 版权所有
深圳市腾讯计算机系统有限公司 ICP备案/许可证号:粤B2-20090059 ![]() 粤公网安备44030502008569号
粤公网安备44030502008569号
腾讯云计算(北京)有限责任公司 京ICP证150476号 | 京ICP备11018762号