
与pykalman的多元回归?
我正在寻找一种使用pykalman从1推广到N回归的方法。我们将不麻烦的在线回归一开始-我只是想要一个玩具的例子,建立卡尔曼滤波为2个回归者,而不是1,即Y = c1 * x1 + c2 * x2 + const。
对于单个回归器的情况,下面的代码可以工作。我的问题是如何更改筛选器设置,以使其适用于两个回归器:
import matplotlib.pyplot as plt
import numpy as np
import pandas as pd
from pykalman import KalmanFilter
if __name__ == "__main__":
file_name = '<path>\KalmanExample.txt'
df = pd.read_csv(file_name, index_col = 0)
prices = df[['ETF', 'ASSET_1']] #, 'ASSET_2']]
delta = 1e-5
trans_cov = delta / (1 - delta) * np.eye(2)
obs_mat = np.vstack( [prices['ETF'],
np.ones(prices['ETF'].shape)]).T[:, np.newaxis]
kf = KalmanFilter(
n_dim_obs=1,
n_dim_state=2,
initial_state_mean=np.zeros(2),
initial_state_covariance=np.ones((2, 2)),
transition_matrices=np.eye(2),
observation_matrices=obs_mat,
observation_covariance=1.0,
transition_covariance=trans_cov
)
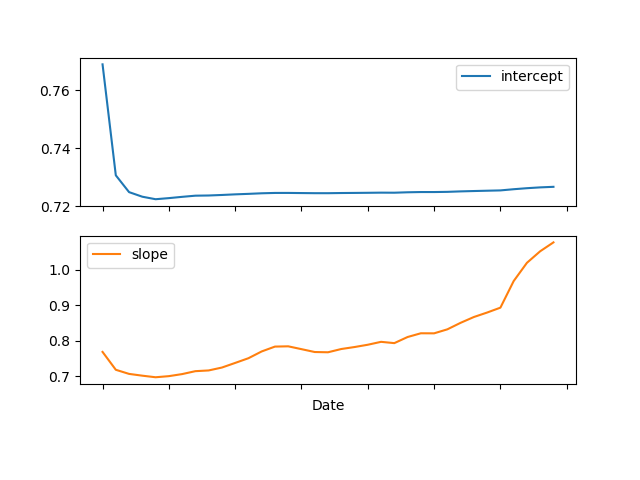
state_means, state_covs = kf.filter(prices['ASSET_1'].values)
# Draw slope and intercept...
pd.DataFrame(
dict(
slope=state_means[:, 0],
intercept=state_means[:, 1]
), index=prices.index
).plot(subplots=True)
plt.show()示例文件KalmanExample.txt包含以下数据:
Date,ETF,ASSET_1,ASSET_2
2007-01-02,176.5,136.5,141.0
2007-01-03,169.5,115.5,143.25
2007-01-04,160.5,111.75,143.5
2007-01-05,160.5,112.25,143.25
2007-01-08,161.0,112.0,142.5
2007-01-09,155.5,110.5,141.25
2007-01-10,156.5,112.75,141.25
2007-01-11,162.0,118.5,142.75
2007-01-12,161.5,117.0,142.5
2007-01-15,160.0,118.75,146.75
2007-01-16,156.5,119.5,146.75
2007-01-17,155.0,120.5,145.75
2007-01-18,154.5,124.5,144.0
2007-01-19,155.5,126.0,142.75
2007-01-22,157.5,124.5,142.5
2007-01-23,161.5,124.25,141.75
2007-01-24,164.5,125.25,142.75
2007-01-25,164.0,126.5,143.0
2007-01-26,161.5,128.5,143.0
2007-01-29,161.5,128.5,140.0
2007-01-30,161.5,129.75,139.25
2007-01-31,161.5,131.5,137.5
2007-02-01,164.0,130.0,137.0
2007-02-02,156.5,132.0,128.75
2007-02-05,156.0,131.5,132.0
2007-02-06,159.0,131.25,130.25
2007-02-07,159.5,136.25,131.5
2007-02-08,153.5,136.0,129.5
2007-02-09,154.5,138.75,128.5
2007-02-12,151.0,136.75,126.0
2007-02-13,151.5,139.5,126.75
2007-02-14,155.0,169.0,129.75
2007-02-15,153.0,169.5,129.75
2007-02-16,149.75,166.5,128.0
2007-02-19,150.0,168.5,130.0单个回归器的情况提供了以下输出,对于两个回归者的情况,我需要第二个表示C2的“斜率”。
回答 1
Stack Overflow用户
发布于 2019-03-24 22:37:00
编辑了的答案,以反映我对这个问题的修正理解.
如果我正确理解,您希望建模一个可观测的输出变量Y = ETF,作为两个可观测值的线性组合;ASSET_1, ASSET_2。
这种回归的系数被视为系统状态,即ETF = x1*ASSET_1 + x2*ASSET_2 + x3,其中x1和x2分别是系数资产1和2,x3是截距。假定这些系数演化缓慢。
下面给出了实现这一点的代码,请注意,这只是在扩展现有的示例,使其具有更多的回归器。
还请注意,通过使用delta参数可以得到完全不同的结果。如果这是大的(远离零),那么系数的变化会更快,回归和重建将接近完美。如果它设置得很小(非常接近于零),那么系数的演化就会更慢,回归的重建也就不那么完美了。您可能需要查看期望最大化算法- 由pykalman。
代码:
import matplotlib.pyplot as plt
import numpy as np
import pandas as pd
from pykalman import KalmanFilter
if __name__ == "__main__":
file_name = 'KalmanExample.txt'
df = pd.read_csv(file_name, index_col = 0)
prices = df[['ETF', 'ASSET_1', 'ASSET_2']]
delta = 1e-3
trans_cov = delta / (1 - delta) * np.eye(3)
obs_mat = np.vstack( [prices['ASSET_1'], prices['ASSET_2'],
np.ones(prices['ASSET_1'].shape)]).T[:, np.newaxis]
kf = KalmanFilter(
n_dim_obs=1,
n_dim_state=3,
initial_state_mean=np.zeros(3),
initial_state_covariance=np.ones((3, 3)),
transition_matrices=np.eye(3),
observation_matrices=obs_mat,
observation_covariance=1.0,
transition_covariance=trans_cov
)
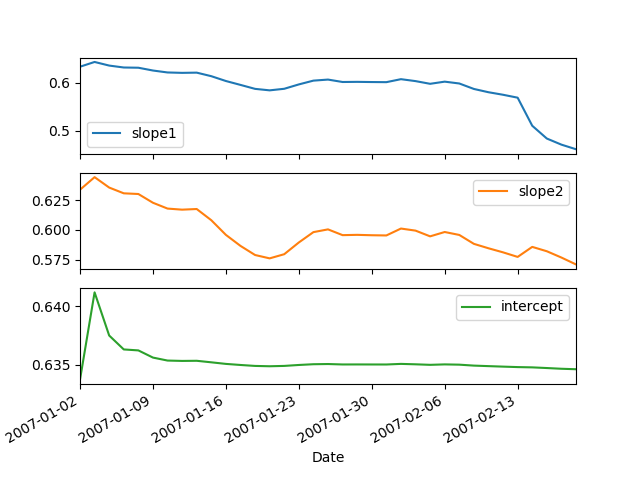
# state_means, state_covs = kf.em(prices['ETF'].values).smooth(prices['ETF'].values)
state_means, state_covs = kf.filter(prices['ETF'].values)
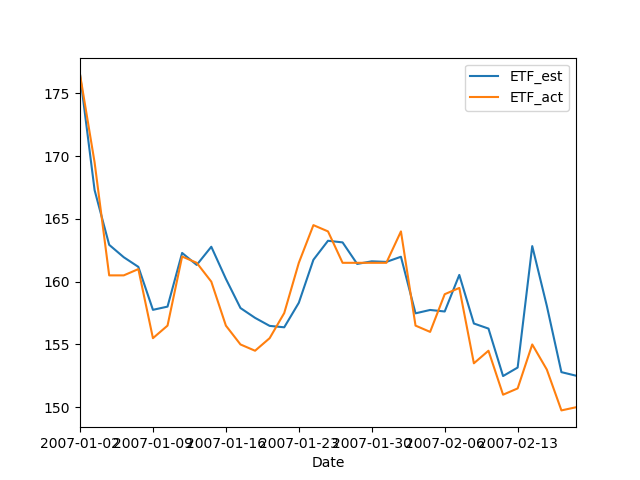
# Re-construct ETF from coefficients and 'ASSET_1' and ASSET_2 values:
ETF_est = np.array([a.dot(b) for a, b in zip(np.squeeze(obs_mat), state_means)])
# Draw slope and intercept...
pd.DataFrame(
dict(
slope1=state_means[:, 0],
slope2=state_means[:, 1],
intercept=state_means[:, 2],
), index=prices.index
).plot(subplots=True)
plt.show()
# Draw actual y, and estimated y:
pd.DataFrame(
dict(
ETF_est=ETF_est,
ETF_act=prices['ETF'].values
), index=prices.index
).plot()
plt.show()情节:
https://stackoverflow.com/questions/55228609
复制相似问题
腾讯云开发者

Copyright © 2013 - 2026 Tencent Cloud. All Rights Reserved. 腾讯云 版权所有
深圳市腾讯计算机系统有限公司 ICP备案/许可证号:粤B2-20090059 ![]() 粤公网安备44030502008569号
粤公网安备44030502008569号
腾讯云计算(北京)有限责任公司 京ICP证150476号 | 京ICP备11018762号