
基于SVR的时间序列预测
我有一个时间序列,我想使用xt来预测xt + 1。我正在使用sklearn的支持向量回归,但我无法理解我做错了什么,在我的预测中有这样的转变。这是我的代码和结果(在图像中)。
bts_sup = timeseries_to_supervised(bts,1)
bts_sup = bts_sup.iloc[1:,:] # delete the line because x0 don't have antecedant
train, test = split_data(bts_sup)
# sacling data
scaler_in = MinMaxScaler() # for inputs
scaler_out = MinMaxScaler() # for outputs
X_train = scaler_in.fit_transform(train[:,0].reshape(-1,1))
y_train = scaler_out.fit_transform(train[:,1].reshape(-1,1))
X_test = scaler_in.transform(test[:,0].reshape(-1,1))
y_test = scaler_out.transform(test[:,1].reshape(-1,1))
param_grid = {"C": np.linspace(10**(-2),10**3,100),
'gamma': np.linspace(0.0001,1,20)}
mod = SVR(epsilon = 0.1,kernel='rbf')
model = GridSearchCV(estimator = mod, param_grid = param_grid,
scoring = "neg_mean_squared_error",verbose = 0)
best_model = model.fit(X_train, y_train.ravel())
#prediction
predicted_tr = model.predict(X_train)
predicted_te = model.predict(X_test)
# inverse_transform because prediction is done on scaled inputs
predicted_tr = scaler_out.inverse_transform(predicted_tr.reshape(-1,1))
predicted_te = scaler_out.inverse_transform(predicted_te.reshape(-1,1))
#plot
forcast = np.concatenate((predicted_tr,predicted_te))
real = np.concatenate((train[:,1],test[:,1]))
plt.plot(real, color = 'blue', label = 'Real Erlangs')
plt.plot(forcast,"--", linewidth=2,color = 'red', label = 'Predicted Erlangs')
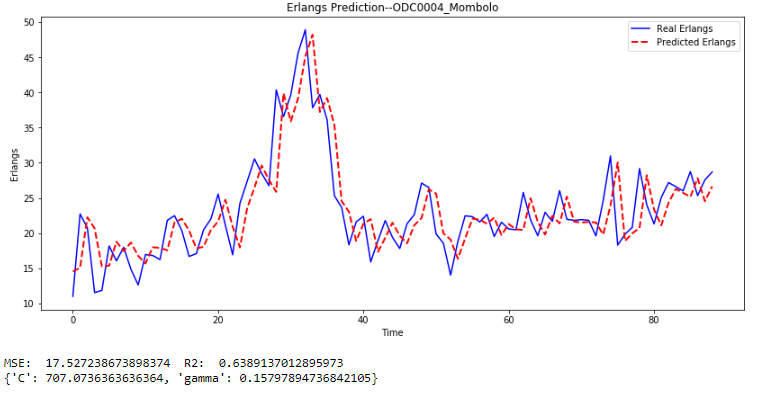
plt.title('Erlangs Prediction--'+data_set.columns[choice])
plt.xlabel('Time')
plt.ylabel('Erlangs')
plt.legend()
plt.show()
#error
print("MSE: ", mse(real,forcast), " R2: ", r2_score(real,forcast))
print(best_model.best_params_)火车
[ 9.26 11.01 22.72 20.75 11.54 11.85 18.17 16.05 17.98 14.62 16.95 16.81 16.23 21.47 16.37 16.68 17.68 17.48 17.99 21.54 21.1 16.23 24.37 30.55 28.47 26.74 40.37 36.55 36.65 45.58 48.91 37.82 39.7 36.09 25.33 23。64 18.33 21.59 22.4 18.89 18.94 21.78 19.38 17.81 21.61 27.11 26.48 19.87 14.03 18.82 22.46 22.33 22.66 19.51 21.54 20.58]
测试
[20.48 25.78 21.89 19.61 22.95 21.67 21.03 21.96 21.81 21.91 21.82 24.61 30.97 18.29 19.84 20.81 29.17 24.01 21.3 25.08 27.18 26.99 28.74 25.32 27.56 28.69]
回答 1
Stack Overflow用户
发布于 2018-12-22 04:28:16
根据我的观察,该模型预测了一个接近前一个时间段的值,作为输入数据。当x_t值较低时,可以观察到较小的方差,模型预测x_t+1值稍高,而当x_t值较高时,情况则相反。
这似乎是最好的猜测,从模型,只有一个滞后的功能。
改进的方法可以是增加额外的特性5-10滞后,让模型学习模式贯穿其中。
对于更复杂的模型,如果支持向量机不起作用,可以尝试RNN进行预测。
https://stackoverflow.com/questions/53890194
复制相似问题
腾讯云开发者

Copyright © 2013 - 2026 Tencent Cloud. All Rights Reserved. 腾讯云 版权所有
深圳市腾讯计算机系统有限公司 ICP备案/许可证号:粤B2-20090059 ![]() 粤公网安备44030502008569号
粤公网安备44030502008569号
腾讯云计算(北京)有限责任公司 京ICP证150476号 | 京ICP备11018762号