
fft在短时历史上寻找低频
我有一个信号历史的时间单位。我的主导频率是1/100个时间单位。当我使用numpy的fft函数时,我的分辨率受到信号历史范围的限制。如何在不破坏信号的情况下提高频率梳的分辨率?
import numpy as np
import matplotlib.pyplot as plt
'''
I need to caputre a low-frequency oscillation with only 1 time unit of data.
So far, I have not been able to find a way to make the fft resolution < 1.
'''
timeResolution = 10000
mytimes = np.linspace(0, 1, timeResolution)
mypressures = np.sin(2 * np.pi * mytimes / 100)


fft = np.fft.fft(mypressures[:])
T = mytimes[1] - mytimes[0]
N = mypressures.size

# fft of original signal is limitted by the maximum time
f = np.linspace(0, 1 / T, N)
filteredidx = f > 0.001
freq = f[filteredidx][np.argmax(np.abs(fft[filteredidx][:N//2]))]
print('freq bin is is ', f[1] - f[0]) # 1.0
print('frequency is ', freq) # 1.0
print('(real frequency is 0.01)')
我认为,通过粘贴信号端到端并进行fft,我可以人为地增加时程长度(从而减小频率梳的宽度)。因为我不明白的原因,这对我没有用:
import numpy as np
import matplotlib.pyplot as plt

timeResolution = 10000
mytimes = np.linspace(0, 1, timeResolution)
mypressures = np.sin(2 * np.pi * mytimes / 100)

# glue data to itself to make signal articicially longer
timesby = 1000
newtimes = np.concatenate([mytimes * ii for ii in range(1, timesby + 1)])
newpressures = np.concatenate([mypressures] * timesby)


fft = np.fft.fft(newpressures[:])
T = newtimes[1] - newtimes[0]
N = newpressures.size

# fft of original signal is limitted by the maximum time
f = np.linspace(0, 1 / T, N)
filteredidx = f > 0.001
freq = f[filteredidx][np.argmax(np.abs(fft[filteredidx][:N//2]))]
print('freq bin is is ', f[1] - f[0]) # 0.001
print('frequency is ', freq) # 1.0
print('(real frequency is 0.01)') 回答 1
Stack Overflow用户
发布于 2018-09-30 18:40:47
您的目标是从“太短”(即<< sample_rate / frequency_of_interest )中恢复光谱信息,窗口似乎雄心勃勃。
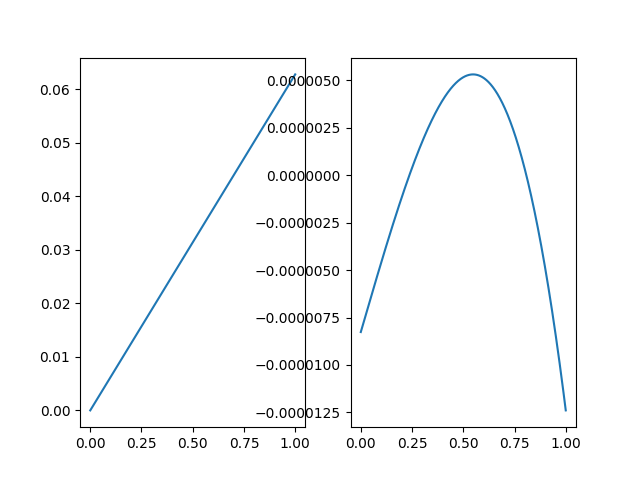
即使在最简单的情况下(干净的正弦波,你的例子),数据看起来也很像一条直线(下面的左面板)。只有在减少趋势后,我们才能看到一点曲率(右下面板,注意非常小的y值),这是所有假设的算法都可以通过的。尤其是英国“金融时报”--据我所见--是行不通的。
如果我们非常幸运的话,有一条出路:比较衍生品。如果你有一个含有偏移量--类似于f = c + sin(om * t‘的信号,那么第一和第三个导数将是om * cos(om * t)和-om^3 * cos(om * t)。如果信号足够简单和干净,这与稳健的数值微分可以用来恢复频率omega。
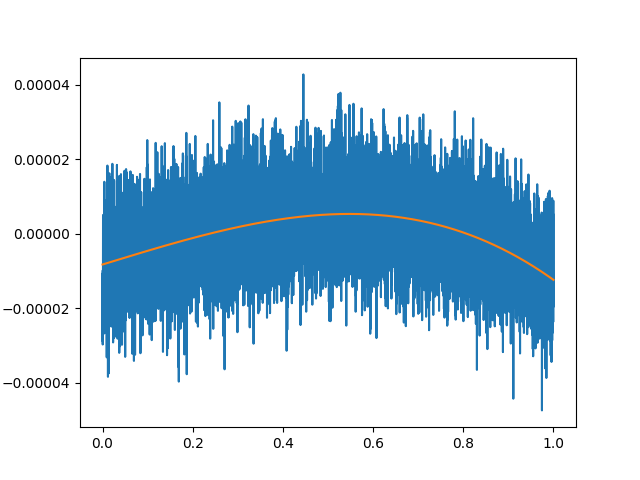
在下面的演示代码中,我使用一个SavGol滤波器来获得导数,同时去除一些高频噪声(下面的蓝色曲线),这些噪声已经添加到信号中(橙色曲线)。其他(更好的)数值微分方法可能存在。
样本运行:
Estimated freq clean signal:   0.009998
Estimated freq noisy signal:   0.009871
我们可以看到,在这个非常简单的情况下,频率恢复正常。
也许可以用更多的导数和一些线性分解的巫毒来恢复多个频率,但我不打算在这里探讨这个问题。
代码:
import numpy as np
import matplotlib.pyplot as plt
'''
I need to caputre a low-frequency oscillation with only 1 time unit of data.
So far, I have not been able to find a way to make the fft resolution < 1.
'''
timeResolution = 10000
mytimes = np.linspace(0, 1, timeResolution)
mypressures = np.sin(2 * np.pi * mytimes / 100)


fft = np.fft.fft(mypressures[:])
T = mytimes[1] - mytimes[0]
N = mypressures.size

# fft of original signal is limitted by the maximum time
f = np.linspace(0, 1 / T, N)
filteredidx = f > 0.001
freq = f[filteredidx][np.argmax(np.abs(fft[filteredidx][:N//2]))]
print('freq bin is is ', f[1] - f[0]) # 1.0
print('frequency is ', freq) # 1.0
print('(real frequency is 0.01)')

import scipy.signal as ss

plt.figure(1)
plt.subplot(121)
plt.plot(mytimes, mypressures)
plt.subplot(122)
plt.plot(mytimes, ss.detrend(mypressures))
plt.figure(2)

mycorrupted = mypressures + 0.00001 * np.random.normal(size=mypressures.shape)
plt.plot(mytimes, ss.detrend(mycorrupted))
plt.plot(mytimes, ss.detrend(mypressures))

width, order = 8999, 3
hw = (width+3) // 2
dsdt = ss.savgol_filter(mypressures, width, order, 1, 1/timeResolution)[hw:-hw]
d3sdt3 = ss.savgol_filter(mypressures, width, order, 3, 1/timeResolution)[hw:-hw]
est_freq_clean = np.nanmean(np.sqrt(-d3sdt3/dsdt) / (2 * np.pi))

dsdt = ss.savgol_filter(mycorrupted, width, order, 1, 1/timeResolution)[hw:-hw]
d3sdt3 = ss.savgol_filter(mycorrupted, width, order, 3, 1/timeResolution)[hw:-hw]
est_freq_noisy = np.nanmean(np.sqrt(-d3sdt3/dsdt) / (2 * np.pi))

print(f"Estimated freq clean signal: {est_freq_clean:10.6f}")
print(f"Estimated freq noisy signal: {est_freq_noisy:10.6f}")https://stackoverflow.com/questions/52579415
复制相似问题
腾讯云开发者

Copyright © 2013 - 2026 Tencent Cloud. All Rights Reserved. 腾讯云 版权所有
深圳市腾讯计算机系统有限公司 ICP备案/许可证号:粤B2-20090059 ![]() 粤公网安备44030502008569号
粤公网安备44030502008569号
腾讯云计算(北京)有限责任公司 京ICP证150476号 | 京ICP备11018762号