
绘制伽马概率密度函数
绘制伽马概率密度函数
提问于 2018-09-18 09:07:04
我试图在R中绘制γ概率密度函数,其中y∈(0,10)对于(k = 1,μ= 1),(k = 2,μ= 1),(k = 2,μ= 2)。在R,
在R中,pgamma函数接受:
pgamma(q, shape, rate = 1, scale = 1/rate, alpha = shape, beta = scale, lower.tail = TRUE, log.p = FALSE)在R,我试过:
pgamma(1,1,rate=1,scale = 1/rate, alpha = shape, beta = scale, lower.tail = True, log.p = False)但我知道消息了
Error in pgamma(1, 1, rate = 1, scale = 1/rate, lower.tail = TRUE, log.p = FALSE) :
object 'rate' not found
这是我第一次绘制伽马分布图,希望能在这方面提供一些帮助。
回答 1
Stack Overflow用户
回答已采纳
发布于 2018-09-18 09:31:02
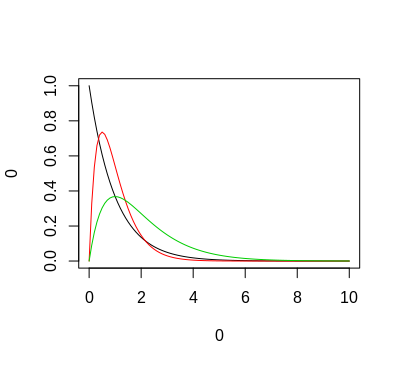
下面用R基图形绘制三个密度图。
首先,您需要的参数值。我假设您的mu是Gamma发行版维基百科页面中定义的。
k <- c(1, 2, 2)
mu <- c(1, 1, 2)
theta <- mu/k
现在,阴谋。
plot(0, 0, xlim = c(0, 10), ylim = c(0, 1), type = "n")
for(i in seq_along(k))
  curve(dgamma(x, shape = k[i], scale = theta[i]), from = 0, to = 10, col = i, add = TRUE)
页面原文内容由Stack Overflow提供。腾讯云小微IT领域专用引擎提供翻译支持
原文链接:
https://stackoverflow.com/questions/52382916
复制相关文章
相似问题
腾讯云开发者

Copyright © 2013 - 2026 Tencent Cloud. All Rights Reserved. 腾讯云 版权所有
深圳市腾讯计算机系统有限公司 ICP备案/许可证号:粤B2-20090059 ![]() 粤公网安备44030502008569号
粤公网安备44030502008569号
腾讯云计算(北京)有限责任公司 京ICP证150476号 | 京ICP备11018762号