
如何使用pykalman filter_update进行在线回归
如何使用pykalman filter_update进行在线回归
提问于 2018-04-17 18:24:36
我想使用kf.filter_update()递归地对输入的价格数据流使用卡尔曼回归,但我无法使它工作。下面是构建问题的示例代码:
数据集(即流):
DateTime             CAT      DOG
2015-01-02 09:01:00, 1471.24, 9868.76
2015-01-02 09:02:00, 1471.75, 9877.75
2015-01-02 09:03:00, 1471.81, 9867.70
2015-01-02 09:04:00, 1471.59, 9849.03
2015-01-02 09:05:00, 1471.45, 9840.15
2015-01-02 09:06:00, 1471.16, 9852.71
2015-01-02 09:07:00, 1471.30, 9860.24
2015-01-02 09:08:00, 1471.39, 9862.94
数据被读取到Pandas数据文件中,下面的代码通过遍历df来模拟流:
df = pd.read_csv('data.txt')
df.dropna(inplace=True)

history = {}
history["spread"] = []
history["state_means"] = []
history["state_covs"] = []

for idx, row in df.iterrows():
    if idx == 0: # Initialize the Kalman filter
        delta = 1e-9
        trans_cov = delta / (1 - delta) * np.eye(2)
        obs_mat = np.vstack([df.iloc[0].CAT, np.ones(df.iloc[0].CAT.shape)]).T[:, np.newaxis]
        kf = KalmanFilter(n_dim_obs=1, n_dim_state=2,
                          initial_state_mean=np.zeros(2),
                          initial_state_covariance=np.ones((2, 2)),
                          transition_matrices=np.eye(2),
                          observation_matrices=obs_mat,
                          observation_covariance=1.0,
                          transition_covariance=trans_cov)

        state_means, state_covs = kf.filter(np.asarray(df.iloc[0].DOG))
        history["state_means"], history["state_covs"] = state_means, state_covs
        slope=state_means[:, 0]
        print "SLOPE", slope

    else:
        state_means, state_covs = kf.filter_update(history["state_means"][-1], history["state_covs"][-1], observation = np.asarray(df.iloc[idx].DOG))
        history["state_means"].append(state_means)
        history["state_covs"].append(state_covs)
        slope=state_means[:, 0]
        print "SLOPE", slope
Kalman滤波器正确初始化,我得到第一个回归系数,但随后的更新会抛出一个异常:
Traceback (most recent call last):
SLOPE [ 6.70319125]
  File "C:/Users/.../KalmanUpdate_example.py", line 50, in <module>
KalmanOnline(df)
  File "C:/Users/.../KalmanUpdate_example.py", line 43, in KalmanOnline
state_means, state_covs = kf.filter_update(history["state_means"][-1], history["state_covs"][-1], observation = np.asarray(df.iloc[idx].DOG))
  File "C:\Python27\Lib\site-packages\pykalman\standard.py", line 1253, in filter_update
2, "observation_matrix"
  File "C:\Python27\Lib\site-packages\pykalman\standard.py", line 38, in _arg_or_default
+ '  You must specify it manually.') % (name,)
ValueError: observation_matrix is not constant for all time.  You must specify it manually.

Process finished with exit code 1
从直觉上看,观察矩阵似乎是必需的(它是在初始步骤中提供的,而不是在更新步骤中提供的),但是我不知道如何正确地设置它。如有任何反馈,将不胜感激。
回答 1
Stack Overflow用户
回答已采纳
发布于 2018-04-18 22:55:10
Pykalman允许您以两种方式声明观察矩阵:
- n_timesteps,n_dim_obs,n_dim_obs -整个估计只有一次
- n_dim_obs,n_dim_obs -分别用于每个估计步骤
在您的代码中,您使用了第一个选项(这就是为什么"observation_matrix不是所有时间不变的“)。但是,您在循环中使用了filter_update,而且Pykalman无法理解在每次迭代中使用什么作为观察矩阵。
我将把观察矩阵声明为一个二元数组:
from pykalman import KalmanFilter
import numpy as np
import pandas as pd
import matplotlib.pyplot as plt
df = pd.read_csv('data.txt')
df.dropna(inplace=True)
n = df.shape[0]
n_dim_state = 2;
history_state_means = np.zeros((n, n_dim_state))
history_state_covs = np.zeros((n, n_dim_state, n_dim_state))
for idx, row in df.iterrows():
if idx == 0: # Initialize the Kalman filter
delta = 1e-9
trans_cov = delta / (1 - delta) * np.eye(2)
obs_mat = [df.iloc[0].CAT, 1]
kf = KalmanFilter(n_dim_obs=1, n_dim_state=2,
initial_state_mean=np.zeros(2),
initial_state_covariance=np.ones((2, 2)),
transition_matrices=np.eye(2),
observation_matrices=obs_mat,
observation_covariance=1.0,
transition_covariance=trans_cov)
history_state_means[0], history_state_covs[0] = kf.filter(np.asarray(df.iloc[0].DOG))
slope=history_state_means[0, 0]
print "SLOPE", slope
else:
obs_mat = np.asarray([[df.iloc[idx].CAT, 1]])
history_state_means[idx], history_state_covs[idx] = kf.filter_update(history_state_means[idx-1],
history_state_covs[idx-1],
observation = df.iloc[idx].DOG,
observation_matrix=obs_mat)
slope=history_state_means[idx, 0]
print "SLOPE", slope
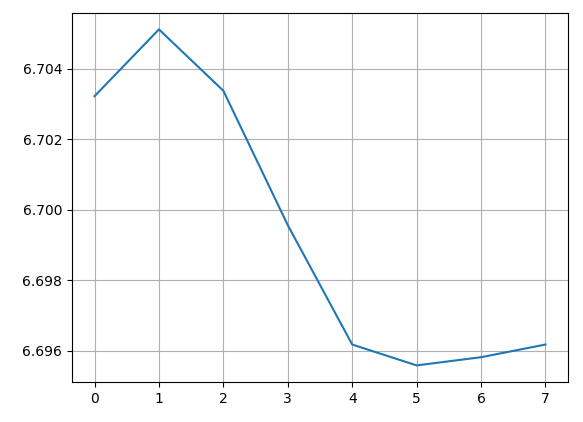
plt.figure(1)
plt.plot(history_state_means[:, 0], label="Slope")
plt.grid()
plt.show()其结果如下:
SLOPE 6.70322464199
SLOPE 6.70512037269
SLOPE 6.70337808649
SLOPE 6.69956406785
SLOPE 6.6961767953
SLOPE 6.69558438828
SLOPE 6.69581682668
SLOPE 6.69617670459
Pykalman并不是很好的文档,而且官方页面上也有错误。这就是为什么我建议在一个步骤中使用离线估计来测试结果。在这种情况下,必须像在代码中那样声明观察矩阵。
from pykalman import KalmanFilter
import numpy as np
import pandas as pd
import matplotlib.pyplot as plt

df = pd.read_csv('data.txt')
df.dropna(inplace=True)

delta = 1e-9
trans_cov = delta / (1 - delta) * np.eye(2)
obs_mat = np.vstack([df.iloc[:].CAT, np.ones(df.iloc[:].CAT.shape)]).T[:, np.newaxis]

kf = KalmanFilter(n_dim_obs=1, n_dim_state=2,
                  initial_state_mean=np.zeros(2),
                  initial_state_covariance=np.ones((2, 2)),
                  transition_matrices=np.eye(2),
                  observation_matrices=obs_mat,
                  observation_covariance=1.0,
                  transition_covariance=trans_cov)

state_means, state_covs = kf.filter(df.iloc[:].DOG)

print "SLOPE", state_means[:, 0]

plt.figure(1)
plt.plot(state_means[:, 0], label="Slope")
plt.grid()
plt.show()
结果是一样的。
页面原文内容由Stack Overflow提供。腾讯云小微IT领域专用引擎提供翻译支持
原文链接:
https://stackoverflow.com/questions/49885025
复制相关文章
相似问题
腾讯云开发者

Copyright © 2013 - 2026 Tencent Cloud. All Rights Reserved. 腾讯云 版权所有
深圳市腾讯计算机系统有限公司 ICP备案/许可证号:粤B2-20090059 ![]() 粤公网安备44030502008569号
粤公网安备44030502008569号
腾讯云计算(北京)有限责任公司 京ICP证150476号 | 京ICP备11018762号