
Stata事件学习图编码
Stata事件学习图编码
提问于 2017-01-12 21:03:42
我正试图为Stata的一个事件研究编写代码,但我无法完全得到我想要的。Jacobson,LaLonde和Sullivan (1993),第698页图3 (http://www.princeton.edu/~davidlee/wp/0.pdf),有一个与我想要的非常相似的情节,除了我也想增加信心区间。
基于本教程jann.pdf,我编写了以下代码:
sysuse auto, clear
egen t = fill(1,2,3,4,1,2,3,4)
quietly regress price ib2.t trunk weight if foreign==0
estimates store domestic
quietly regress price ib2.t trunk weight if foreign==1
estimates store foreign
coefplot (domestic, label(Domestic Cars)) (foreign, label(Foreign Cars)), drop(_cons) xline(0) vertical omitted baselevels
这就产生了一些我想要的东西,但有以下问题:
- 点估计值和置信区间是并排的,而不是相互之间的(如果这是唯一的问题,这可能是好的)。
- 我的时间变量t出现在每个x标签(t=1、t=2等)中,但我只想说(1,2,等等)。没有t=。
- 在这个玩具例子中,我必须从1开始我的t编号,因为与
i运算符结合的因子变量需要是非负的。我希望我的时间变量能够接受负数。 - 我不想让
trunk和weight出现在情节里。把这些放在drop(...)里好吗? - 我也希望能够在回归残差中完成所有这一切,而不是上面的内容。
- 我想把点估计和线联系起来。
我根本没有嫁给coefplot命令。其他技术,特别是使用内置Stata命令,也是完全可以接受的。
回答 1
Stack Overflow用户
回答已采纳
发布于 2017-01-20 21:51:49
希望我已经正确回答了你的问题,也许我误解了什么,但以下是我的答案:
(我没有解决5,因为我不知道你用这个问题到底在寻找什么,但也许在看到我的解决方案之后就会很清楚了)
代码:
// load data same as before
sysuse auto, clear
egen t = fill(1,2,3,4,1,2,3,4)
// get coefficients and standard errors of regressions over foreign
statsby _b _se , clear by(foreign): regress price ib2.t trunk weight
// there are some extra variables we don't need/want
drop *_trunk *_weight *_cons
// generate confidence intervals and rename coefficient variables
forvalues i = 1/4 {
local j = `i'+7
gen ci_low`i' = _stat_`i' - 1.96*_stat_`j'
gen ci_high`i' = _stat_`i' + 1.96*_stat_`j'
rename _stat_`i' coef`i'
}
// no longer in need of standard error variables
drop _stat_8 _stat_9 _stat_10 _stat_11
// now, we want our data in long format so we can do a twoway graph
reshape long coef ci_low ci_high, i(foreign) j(t)
// we can label the t values so that they start below 1
lab def timeseries 1 "-1" 2 "0" 3 "1" 4 "2"
lab values t timeseries
// now graph, note each factor has two pieces, a scatter (with connecting lines)
// and an rcap for the confidence intervals
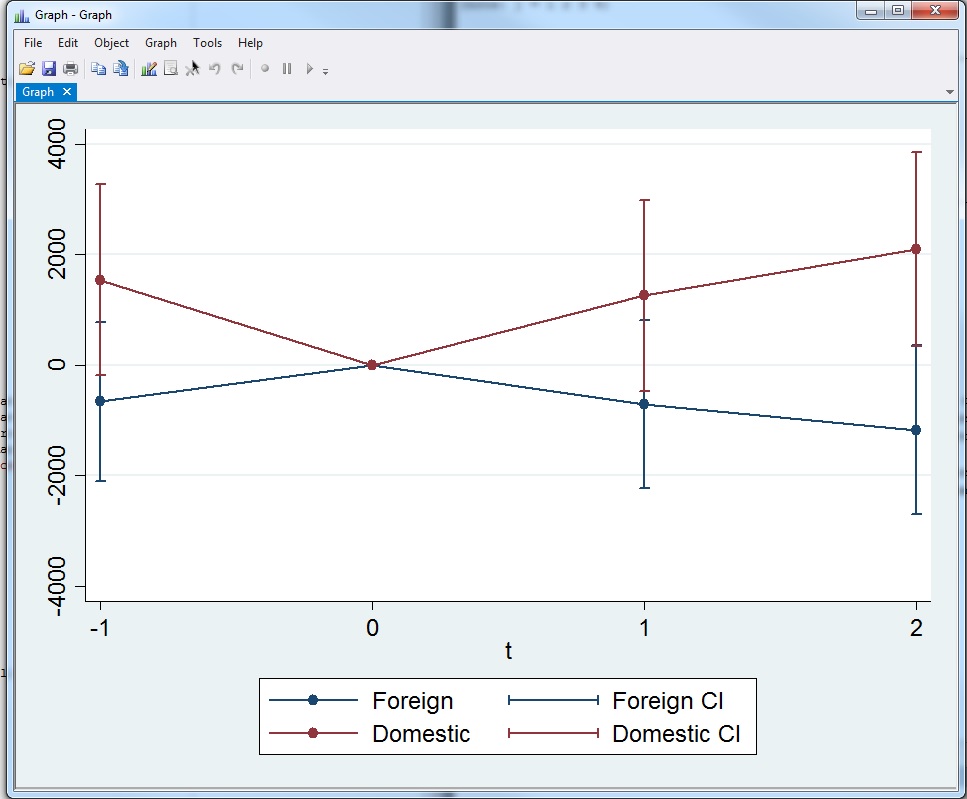
twoway (sc coef t if foreign == 1, mcolor(navy) lcolor(navy) connect(direct)) ///
(rcap ci_low ci_high t if foreign == 1, lcolor(navy)) ///
(sc coef t if foreign == 0, mcolor(maroon) lcolor(maroon) connect(direct)) ///
(rcap ci_low ci_high t if foreign == 0, lcolor(maroon)), ///
legend(lab(1 "Foreign") lab(2 "Foreign CI") lab(3 "Domestic") lab(4 "Domestic CI")) ///
xlab(,val)
人们可能希望改善这一状况的一些方式是:
- 有了标签定义,我们就可以使用for循环来处理时间序列,而不是全部手工完成。
- 我不是一个关于统计的专家,所以也许有一个更容易的方法来获得信心间隔,并省去躯干、体重和恒定值。
至于残差,这个答案的基本直觉是你想要一个包含系数和置信区间的数据集。因此,如果您可以计算残差及其CI的值,并将它们放入数据集中,那么您可以使用相同类型的双维图。
页面原文内容由Stack Overflow提供。腾讯云小微IT领域专用引擎提供翻译支持
原文链接:
https://stackoverflow.com/questions/41622943
复制相关文章
相似问题
腾讯云开发者

Copyright © 2013 - 2026 Tencent Cloud. All Rights Reserved. 腾讯云 版权所有
深圳市腾讯计算机系统有限公司 ICP备案/许可证号:粤B2-20090059 ![]() 粤公网安备44030502008569号
粤公网安备44030502008569号
腾讯云计算(北京)有限责任公司 京ICP证150476号 | 京ICP备11018762号