
稳健回归的sjPlot?
稳健回归的sjPlot?
提问于 2016-08-21 04:06:06
是否有人知道sjp.Int是否适用于稳健的回归?基本绘图工作,但置信区间不工作?Error=
Error in seq.default(from = best$lmin, to = best$lmax, by = best$lstep) :
 'from' must be of length 1
 In addition: Warning messages:
  1: In min(intdf$conf.low, na.rm = T) :
  no non-missing arguments to min; returning Inf
  2: In max(intdf$conf.high, na.rm = T) :
  no non-missing arguments to max; returning -Inf
我使用的命令是:
fname = rlm(Y ~ X1+X2+X3+X4*X5, data=mydata)
sjp.int(fname, type="eff", show.ci=TRUE)
对于type="cond",置信区间确实有效。
回答 1
Stack Overflow用户
回答已采纳
发布于 2016-08-21 09:21:48
我认为这是不可能的。sjp.int(type="eff")使用effects::allEffects()来计算CI等,但是这个函数不计算rlm.model的CI (返回NAs),所以sjp.int(rlm.model, type="eff", show.ci=TRUE)不能工作。(参考代码;summary(effects::allEffects(fname, KR=F)))。
编辑过的
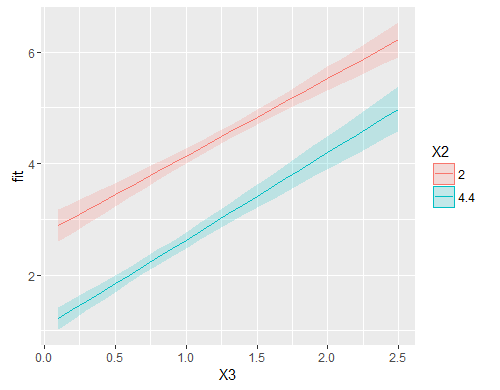
(sjp.int(fname, type="eff"))返回data.list,它有关于se的信息。但我不认为这个价值是可信的。如果您想要绘制像sjp.int这样的图形,我认为最好使用predict(rlm.model),因为predict有一种治疗rlm.model的方法。
我的榜样;
library(ggplot2)

df <- with(iris, data.frame(Y = Petal.Length,     # example data
                            X1 = Sepal.Length, X2 = Sepal.Width, X3 = Petal.Width))

fname <- rlm(Y ~ X1 + X2 * X3, df)
pred.df <- with(df, data.frame(X1 = mean(X1),
                               X2 = c( min(X2), max(X2) ),
                               X3 = rep( seq( min(X3), max(X3), 0.1), each=2 )))

pred.df <- cbind(pred.df, predict(fname, pred.df, interval="confidence"))
pred.df$X2 <- as.factor(pred.df$X2)

ggplot(pred.df, aes(x=X3, y=fit, group=X2, colour=X2, fill=X2)) + geom_line() +
  geom_ribbon(aes(ymin = lwr, ymax = upr, colour=NULL), alpha=0.2)
页面原文内容由Stack Overflow提供。腾讯云小微IT领域专用引擎提供翻译支持
原文链接:
https://stackoverflow.com/questions/39060754
复制相关文章
相似问题
腾讯云开发者

Copyright © 2013 - 2026 Tencent Cloud. All Rights Reserved. 腾讯云 版权所有
深圳市腾讯计算机系统有限公司 ICP备案/许可证号:粤B2-20090059 ![]() 粤公网安备44030502008569号
粤公网安备44030502008569号
腾讯云计算(北京)有限责任公司 京ICP证150476号 | 京ICP备11018762号