
如何检测图像中的圆形区域并用Python对其进行中心化?
如何检测图像中的圆形区域并用Python对其进行中心化?
提问于 2015-07-29 15:52:46
我有一个数字火焰的形式如下:
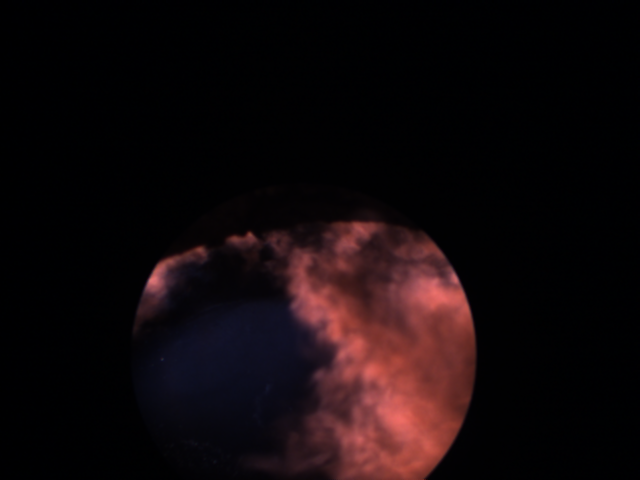
我试图检测相机的外部边缘和中心的图形,这样圆形的火焰视图正是在中心的情节。因为圆圈的位置可能会随着图像捕获日期的变化而改变。有时可能是上半身,有时是下半身,等等。
Python中是否有任何模块可以检测视图并将其中心化?
可复制代码
import numpy as np
import matplotlib.pyplot as plt
import matplotlib.image as mpimg
img=mpimg.imread('flame.png')
lum_img = img[:,:,0]
img_plot = plt.imshow(lum_img)
img_plot.set_cmap('jet')
plt.axis('Off')
plt.show()回答 2
Stack Overflow用户
回答已采纳
发布于 2015-07-29 18:08:33
改编自this answer,进行边缘检测,并使用RANSAC可靠地将一个圆圈与轮廓相匹配:
from __future__ import print_function
from skimage import io, feature, color, measure, draw, img_as_float
import numpy as np
image = img_as_float(color.rgb2gray(io.imread('flame.png')))
edges = feature.canny(image)
coords = np.column_stack(np.nonzero(edges))
model, inliers = measure.ransac(coords, measure.CircleModel,
min_samples=3, residual_threshold=1,
max_trials=1000)
print(model.params)
rr, cc = draw.circle_perimeter(int(model.params[0]),
int(model.params[1]),
int(model.params[2]),
shape=image.shape)
image[rr, cc] = 1
import matplotlib.pyplot as plt
plt.imshow(image, cmap='gray')
plt.scatter(model.params[1], model.params[0], s=50, c='red')
plt.axis('off')
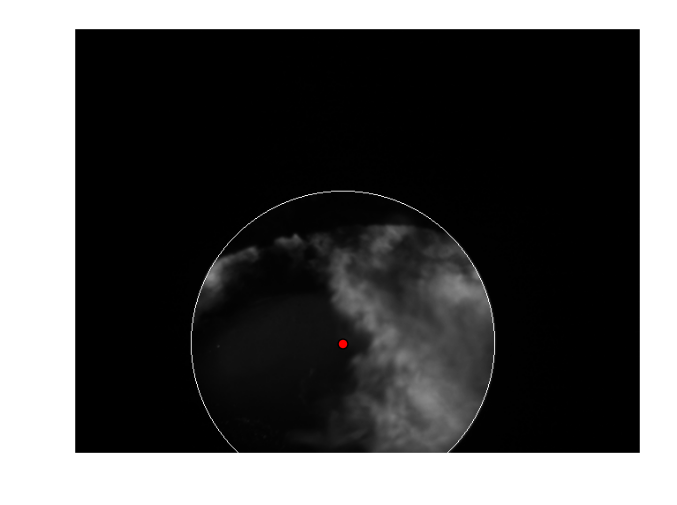
plt.savefig('/tmp/flame_center.png', bbox_inches='tight')
plt.show()这产生了:
Stack Overflow用户
发布于 2015-07-29 17:55:17
我觉得你有很多选择。两个简单的方法,在我的脑海中将是阈值你的输入图像的低强度值,这将给你一个白色的圆圈。然后你可以在上面运行Hough变换来找到中心。
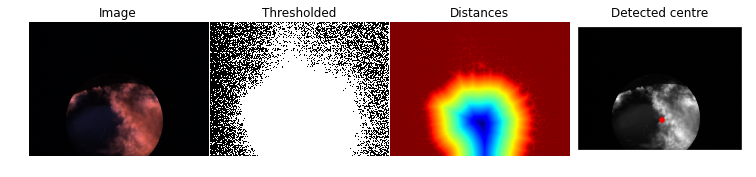
或者您可以使用阈值白像素的距离变换,并取此距离变换的最大值:
# code derived from watershed example of scikit-image
# http://scikit-image.org/docs/dev/auto_examples/plot_watershed.html

import numpy as np
import matplotlib.pyplot as plt
from scipy import ndimage as ndi

from skimage.morphology import watershed
from skimage.feature import peak_local_max
from skimage.color import rgb2gray
from skimage.io import imread

img = imread('flame.png')
image = rgb2gray(img) > 0.01

# Now we want to separate the two objects in image
# Generate the markers as local maxima of the distance to the background
distance = ndi.distance_transform_edt(image)

# get global maximum like described in
# http://stackoverflow.com/a/3584260/2156909
max_loc = unravel_index(distance.argmax(), distance.shape)

fig, axes = plt.subplots(ncols=4, figsize=(10, 2.7))
ax0, ax1, ax2, ax3 = axes

ax0.imshow(img,interpolation='nearest')
ax0.set_title('Image')
ax1.imshow(image, cmap=plt.cm.gray, interpolation='nearest')
ax1.set_title('Thresholded')
ax2.imshow(-distance, cmap=plt.cm.jet, interpolation='nearest')
ax2.set_title('Distances')
ax3.imshow(rgb2gray(img), cmap=plt.cm.gray, interpolation='nearest')
ax3.set_title('Detected centre')
ax3.scatter(max_loc[1], max_loc[0], color='red')

for ax in axes:
    ax.axis('off')

fig.subplots_adjust(hspace=0.01, wspace=0.01, top=1, bottom=0, left=0,
                    right=1)
plt.show()

为了让您知道这个方法有多健壮,如果我选择一个非常糟糕的阈值(image = rgb2gray(img) > 0.001 --太低了,无法得到一个很好的圆圈),结果几乎是一样的:
页面原文内容由Stack Overflow提供。腾讯云小微IT领域专用引擎提供翻译支持
原文链接:
https://stackoverflow.com/questions/31705355
复制相关文章
相似问题
腾讯云开发者

Copyright © 2013 - 2026 Tencent Cloud. All Rights Reserved. 腾讯云 版权所有
深圳市腾讯计算机系统有限公司 ICP备案/许可证号:粤B2-20090059 ![]() 粤公网安备44030502008569号
粤公网安备44030502008569号
腾讯云计算(北京)有限责任公司 京ICP证150476号 | 京ICP备11018762号