
ssa结果中解释方差的提取百分比(Ssa)
ssa结果中解释方差的提取百分比(Ssa)
提问于 2014-10-02 06:44:23
我正在使用Rssa软件包来分解时间序列,它工作得很好,只是我无法从每个特征向量中得到解释方差的百分比(如果这些是正确的话)。但是,这些百分比是在我可以用这个包绘制的一个图表上面注明的。让我举一个例子:
d=rnorm(200,10,3)
plot(d,type="l")
ssa=ssa(d, L = 100,digits=0)
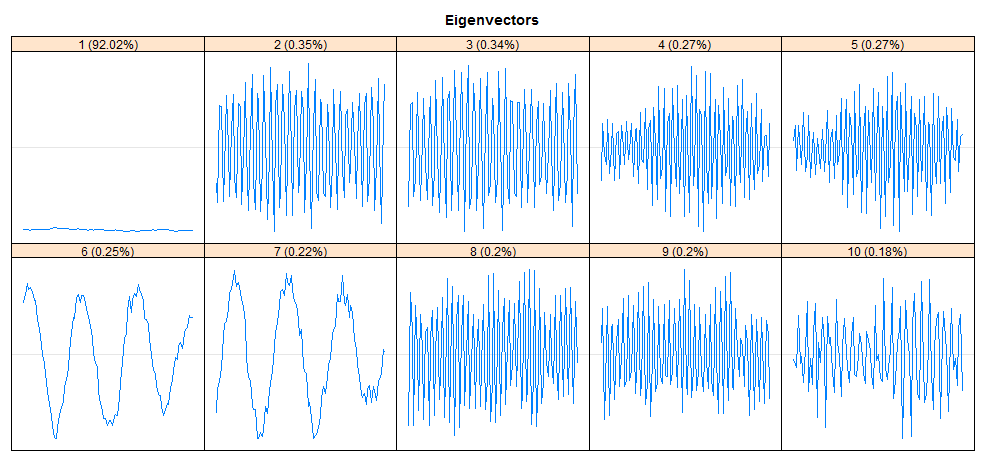
plot(ssa,type="vector") #the percentage I want is in the title of each individual graph
# to reconstruct the trend and the residuals
res <- reconstruct(ssa, groups = list(1))
trend <- res$F1我如何在向量中得到这些百分比?尤其是我想要循环多个系列。谢谢!
回答 2
Stack Overflow用户
回答已采纳
发布于 2014-10-02 07:35:14
似乎按组件计算的序列的加权范数的代码隐藏在包中。我从Rssa:::.plot.ssa.vectors.1d.ssa中提取代码并将其包装成一个小函数:
component_wnorm <-
function(x) {
  idx <- seq_len(min(nsigma(x), 10))
  x <- ssa
  total <- wnorm(x)^2
  round(100*x$sigma[idx]^2 / total, digits = 2)
}

component_wnorm(ssa)
[1] 92.02  0.35  0.34  0.27  0.27  0.25  0.22  0.20  0.20  0.18
Stack Overflow用户
发布于 2018-08-21 23:39:01
最近版本的Rssa具有函数contributions。因此,您可以使用
> s <- ssa(d, L=100)
> c <- contributions(s)*100
> print(c[1:10], digits = 2)
[1] 92.41 0.28 0.26 0.26 0.26 0.23 0.23 0.21 0.20 0.20页面原文内容由Stack Overflow提供。腾讯云小微IT领域专用引擎提供翻译支持
原文链接:
https://stackoverflow.com/questions/26155619
复制相关文章
相似问题
腾讯云开发者

Copyright © 2013 - 2026 Tencent Cloud. All Rights Reserved. 腾讯云 版权所有
深圳市腾讯计算机系统有限公司 ICP备案/许可证号:粤B2-20090059 ![]() 粤公网安备44030502008569号
粤公网安备44030502008569号
腾讯云计算(北京)有限责任公司 京ICP证150476号 | 京ICP备11018762号