
R线图中点的排序
R线图中点的排序
提问于 2014-09-08 18:21:38
我想在散乱点上增加一条二次拟合的拟合线,但是点的排序有点混乱。
attach(mtcars)
plot(hp, mpg)
fit <- lm(mpg ~ hp + I(hp^2))
summary(fit)
res <- data.frame(cbind(mpg, fitted(fit), hp))
with(res, plot(hp, mpg))
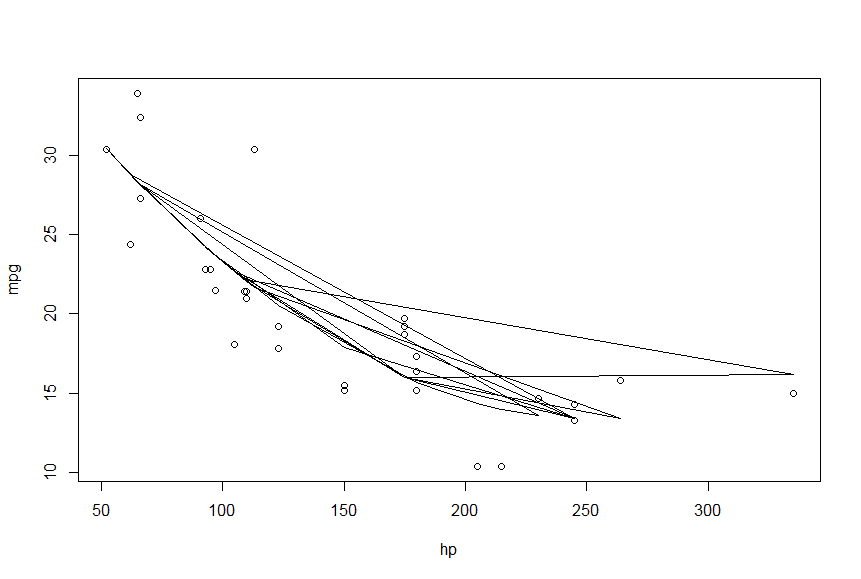
with(res, lines(hp, V2))这画了整个地方的线条,而不是通过散落点适合的烟雾。我肯定这很简单,但我有点困惑。
回答 1
Stack Overflow用户
回答已采纳
发布于 2014-09-08 18:24:15
当你画一条线时,所有的点都是按接收到的顺序连接的。看起来您想在连接点之前对hp值进行排序。
res <- data.frame(cbind(mpg, fitted(fit), hp))
res <- res[order(hp), ]
with(res, plot(hp, mpg))
with(res, lines(hp, V2))
要获得
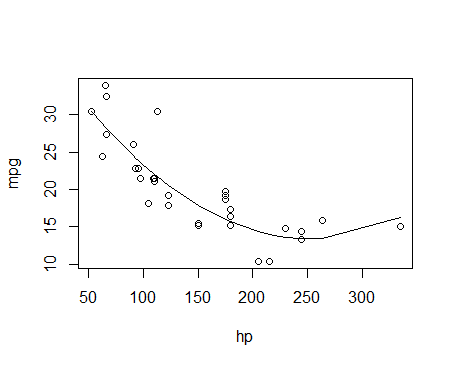
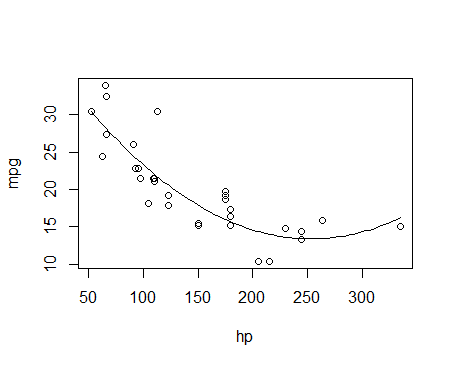
此外,为了获得一条更平滑的线条,您可以考虑在所观察到的hp值以外的其他点进行预测。当你符合你的模型,你可以做
php <- seq(min(hp), max(hp), length.out=100)
p <- predict(fit, newdata=data.frame(hp=php))
plot(hp, mpg)
lines(php, p)
页面原文内容由Stack Overflow提供。腾讯云小微IT领域专用引擎提供翻译支持
原文链接:
https://stackoverflow.com/questions/25730676
复制相关文章
相似问题
腾讯云开发者

Copyright © 2013 - 2026 Tencent Cloud. All Rights Reserved. 腾讯云 版权所有
深圳市腾讯计算机系统有限公司 ICP备案/许可证号:粤B2-20090059 ![]() 粤公网安备44030502008569号
粤公网安备44030502008569号
腾讯云计算(北京)有限责任公司 京ICP证150476号 | 京ICP备11018762号