
Likert软件包- include.histogram + ggsave的问题
我使用jbryer的利克特包来绘制likert数据,到目前为止,它运行得相当好。
1.但是,当我将include.histogram = TRUE添加到我现有的情节中时,我会发现一个错误:
二进制运算符的非数值参数
参见提供的示例数据集:https://dl.dropboxusercontent.com/u/109495328/example.ods和我在其上执行的代码(我的数据被称为rawdata)。
library(ggplot2)
library(reshape2)
library(likert)
require(devtools)
install_github('likert', 'jbryer')

teaching_liking <- rawdata[, substr(names(rawdata), 1, 4) == "B004"]
teaching_liking <- rename(teaching_liking, c(B004_01 = "expertise in the subject", B004_02 = "ability to engage students", B004_03 = "clarity", B004_04 = "attendance and punctuality to lessons", B004_05 = "attendance and punctuality to office hours", B004_06 = "availability to the relationship with students"))
i <- 1
while(i<=ncol(teaching_liking)) {
  teaching_liking[[i]] = factor(teaching_liking[[i]],labels = c("Not at all", "A bit", "Enough", "Much"), levels=c(1:4))
  i <- i + 1
}
teaching_liking_plot <- likert(teaching_liking)
p <- plot(teaching_liking_plot, centered = FALSE, wrap = 30, include.histogram = TRUE) + ggtitle("How satisfied are you with the following aspects?*")
g <- arrangeGrob(p, sub = textGrob("*Order of questions were randomized in questionaire.", x = 0, hjust = -0.1, vjust=0.1, gp = gpar(fontface = "italic", fontsize = 10)))
print(p)
ggsave((filename="teaching_liking.pdf"), scale = 1, width = par("din")[1], height = par("din")[2], units = c("in", "cm", "mm"), dpi = 300, limitsize = TRUE, g)
2.在极少数情况下,当我设法用直方图得到完整的网叠图时,我无法通过to图将它们保存在一个地块中。它将保存利克特刻度或只是直方图,但永远不会两者兼而有之。
回答 2
Stack Overflow用户
发布于 2014-01-19 23:13:54
这可能是plot.likert(...)中的一个bug,或者至少是无文档的行为。
p <- plot(teaching_liking_plot, centered = FALSE, wrap = 30, include.histogram = F)
class(p)
# [1] "likert.bar.plot" "gg"              "ggplot"

p <- plot(teaching_liking_plot, centered = FALSE, wrap = 30, include.histogram = T)
class(p)
# [1] "NULL"在第一种情况下,plot.likert(...)不显示情节,而是将p作为"likert.bar.plot“对象返回。在第二种情况下,plot.likert(...)确实显示了情节,但返回了NULL (换句话说,p设置为NULL)。这就是为什么在尝试将plot(..., include.histogram=T)的结果添加到ggtitle(...)时会出现错误。
编辑
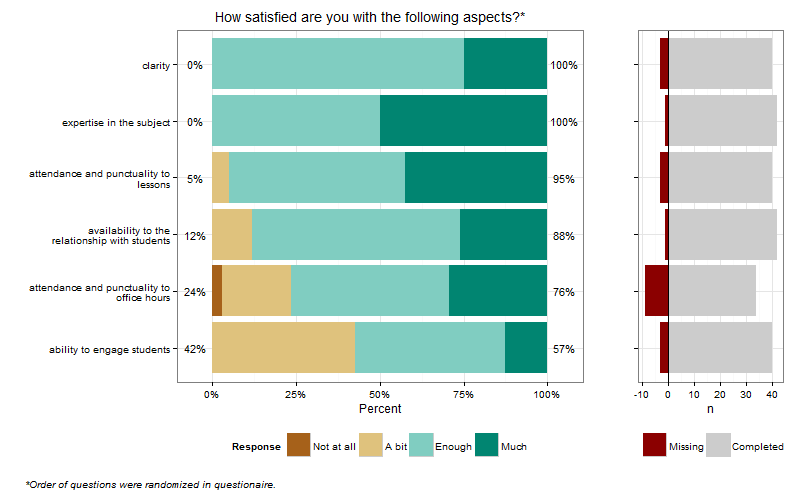
这里有个解决办法。生成下面的图作为一个grob,可以保存、编辑等等。代码在绘图之后。不能完全匹配颜色,但非常接近。工作流程如下:
- 负载数据
- 设置类别和响应标签
- 按类别创建响应条形图
- 创建缺失/已完成响应的条形图
- 结合成一个带注释的grob
- 保存
## Version of likert analysis, with missing response histogram
libs <- list("reshape2","plyr","ggplot2","gridExtra","scales","RColorBrewer","data.table")
z    <- lapply(libs,library,character.only=T)

rawdata <- fread("example.csv")   # read rawdata into a data.table
teaching_liking <- rawdata[substr(names(rawdata), 1, 4) == "B004"]
# set up category and response labels
categories <- c(B004_01 = "expertise in the subject",
                B004_02 = "ability to engage students",
                B004_03 = "clarity",
                B004_04 = "attendance and punctuality to lessons",
                B004_05 = "attendance and punctuality to office hours",
                B004_06 = "availability to the relationship with students")
responses  <- c("Not at all", "A bit", "Enough", "Much")
# create the barplot of responses by category
ggB <- melt(teaching_liking, measure.vars=1:6, value.name="Response", variable.name="Category")
ggB[,resp.above:=sum(Response>2,na.rm=T)/sum(Response>0,na.rm=T),by=Category]
ggB[,resp.below:=sum(Response<3,na.rm=T)/sum(Response>0,na.rm=T),by=Category]
ggB[,Category:=reorder(Category,resp.above)]    # sets the order of the bars
ggT <- unique(ggB[,list(Category,resp.below,resp.above)])
ggT[,label.below:=paste0(round_any(100*resp.below,1),"%")]
ggT[,label.above:=paste0(round_any(100*resp.above,1),"%")]
cat <- categories[levels(ggB$Category)]                       # category labels
cat <- lapply(strwrap(cat,30,simplify=F),paste,collapse="\n") # word wrap
ggBar <- ggplot(na.omit(ggB)) +
  geom_histogram(aes(x=Category, fill=factor(Response)),position="fill")+
  geom_text(data=ggT,aes(x=Category, y=-.05, label=label.below),hjust=.5, size=4)+
  geom_text(data=ggT,aes(x=Category, y=1.05, label=label.above),hjust=.5, size=4)+
  theme_bw()+
  theme(legend.position="bottom")+
  labs(x="",y="Percent")+
  scale_y_continuous(labels=percent)+
  scale_x_discrete(labels=cat)+
  scale_fill_manual("Response",breaks=c(1,2,3,4),labels=responses, values=brewer.pal(4,"BrBG"))+
  coord_flip()
ggBar
# create the histogram of Missing/Completed by category
ggH <- ggB[,list(Missing=sum(is.na(Response)),Completed=sum(!is.na(Response))),by="Category,resp.above"]
ggH[,Category:=reorder(Category,resp.above)]
ggH <- melt(ggH, measure.vars=3:4)
ggHist <- ggplot(ggH) +
  geom_bar(data=subset(ggH,variable=="Missing"),aes(x=Category,y=-value, fill=variable),stat="identity")+
  geom_bar(data=subset(ggH,variable=="Completed"),aes(x=Category,y=+value, fill=variable),stat="identity")+
  geom_hline(yintercept=0)+
  theme_bw()+
  theme(legend.position="bottom")+
  theme(axis.text.y=element_blank())+
  labs(x="",y="n")+
  scale_fill_manual("",values=c("grey80","dark red"),breaks=c("Missing","Completed"))+
  coord_flip()
ggHist
# put it all together in a grid object, then save to pdf
grob <- arrangeGrob(ggBar,ggHist,ncol=2,widths=c(0.75,0.25),
                    main= textGrob("How satisfied are you with the following aspects?*",
                                   hjust=.6, vjust=1.5,
                                   gp = gpar(fontsize = 14)),
                    sub = textGrob("*Order of questions were randomized in questionaire.",
                                   x = 0, hjust = -0.1, vjust=0.1,
                                   gp = gpar(fontface = "italic", fontsize = 10)))
grob
ggsave(file="teaching_liking.pdf",grob)Stack Overflow用户
发布于 2014-01-20 23:12:13
这是第2部分的答案,我必须回到第1部分。
ggsave函数将保存ggplot的最后一次调用。因为柱状图和条形图(左边)是两个单独的对ggplot的调用,所以ggsave只保存最后一个。试一试:
pdf(‘mylikertplot.pdf’)
plot(l)
dev.off()
注对于其他文件格式(例如png),除了pdf之外,还有其他功能。它们也有宽度和高度参数。
https://stackoverflow.com/questions/21221248
复制相似问题
腾讯云开发者

Copyright © 2013 - 2026 Tencent Cloud. All Rights Reserved. 腾讯云 版权所有
深圳市腾讯计算机系统有限公司 ICP备案/许可证号:粤B2-20090059 ![]() 粤公网安备44030502008569号
粤公网安备44030502008569号
腾讯云计算(北京)有限责任公司 京ICP证150476号 | 京ICP备11018762号