
标签和彩色叶树状图
标签和彩色叶树状图
提问于 2013-09-14 13:59:56
我试图创建一个树状图,如果我的样本有5个组代码(作为样本名称/物种/等等,但它是重复的)。
因此,我有两个很大的帮助问题:
- 如何在叶标签(而不是样本编号)中显示组代码?
- 我希望为每个代码组分配一个颜色,并根据它对叶标签进行着色(可能会发生它们不在同一类中,并由此可以找到更多的信息)?
是否可以用我的脚本这样做(ape或ggdendro):
sample<-read.table("C:/.../DOutput.txt", header=F, sep="")
groupCodes <- sample[,1]
sample2<-sample[,2:100]
d <- dist(sample2, method = "euclidean")
fit <- hclust(d, method="ward")
plot(as.phylo(fit), type="fan")
ggdendrogram(fit, theme_dendro=FALSE)
替换我的read.table的随机数据文件:
sample = data.frame(matrix(floor(abs(rnorm(20000)*100)),ncol=200))
groupCodes <- c(rep("A",25), rep("B",25), rep("C",25), rep("D",25)) # fixed error
sample2 <- data.frame(cbind(groupCodes), sample) 回答 2
Stack Overflow用户
回答已采纳
发布于 2013-09-16 16:01:56
下面是一个解决这个问题的方法,它使用了一个名为"dendextend“的新包,它正是为这类东西构建的。
在软件包的演示文稿和小片段中,您可以在以下网址中的“使用”部分中看到许多示例:https://github.com/talgalili/dendextend
下面是这个问题的解决方案:(注意如何重新排序颜色以首先拟合数据,然后拟合树状图的新顺序的重要性)
####################
## Getting the data:
sample = data.frame(matrix(floor(abs(rnorm(20000)*100)),ncol=200))
groupCodes <- c(rep("Cont",25), rep("Tre1",25), rep("Tre2",25), rep("Tre3",25))
rownames(sample) <- make.unique(groupCodes)
colorCodes <- c(Cont="red", Tre1="green", Tre2="blue", Tre3="yellow")
distSamples <- dist(sample)
hc <- hclust(distSamples)
dend <- as.dendrogram(hc)
####################
## installing dendextend for the first time:
install.packages('dendextend')
####################
## Solving the question:
# loading the package
library(dendextend)
# Assigning the labels of dendrogram object with new colors:
labels_colors(dend) <- colorCodes[groupCodes][order.dendrogram(dend)]
# Plotting the new dendrogram
plot(dend)
####################
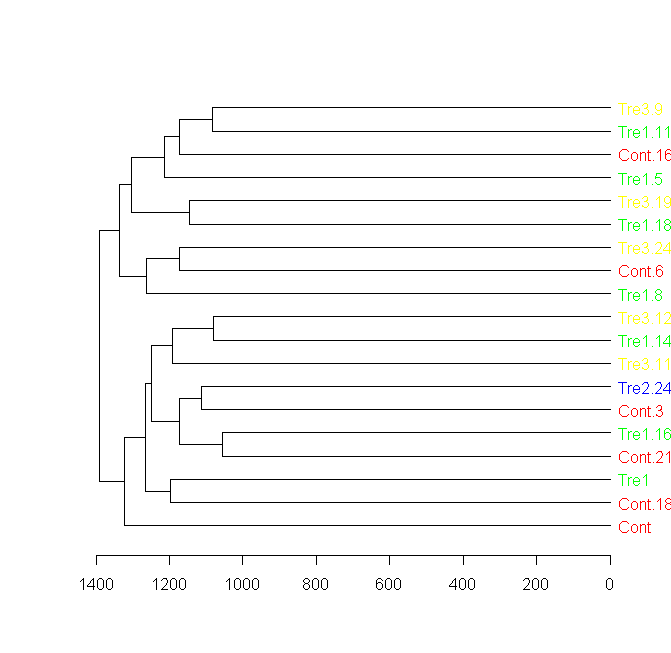
## A sub tree - so we can see better what we got:
par(cex = 1)
plot(dend[[1]], horiz = TRUE)
Stack Overflow用户
发布于 2013-09-14 15:05:47
您可以将hclust对象转换为dendrogram,并使用?dendrapply修改属性(如颜色、标签、.)每个节点,例如:
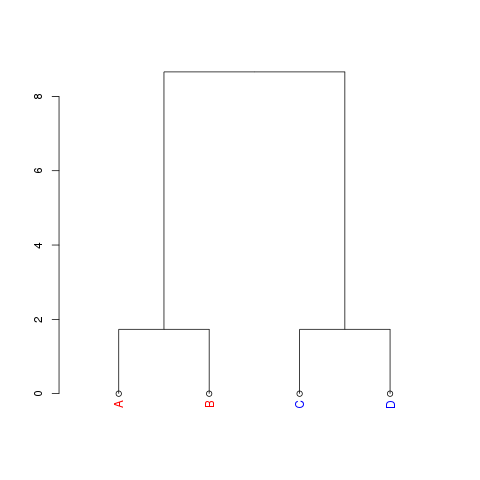
## stupid toy example
samples <- matrix(c(1, 1, 1,
                    2, 2, 2,
                    5, 5, 5,
                    6, 6, 6), byrow=TRUE, nrow=4)

## set sample IDs to A-D
rownames(samples) <- LETTERS[1:4]

## perform clustering
distSamples <- dist(samples)
hc <- hclust(distSamples)

## function to set label color
labelCol <- function(x) {
  if (is.leaf(x)) {
    ## fetch label
    label <- attr(x, "label")
    ## set label color to red for A and B, to blue otherwise
    attr(x, "nodePar") <- list(lab.col=ifelse(label %in% c("A", "B"), "red", "blue"))
  }
  return(x)
}

## apply labelCol on all nodes of the dendrogram
d <- dendrapply(as.dendrogram(hc), labelCol)

plot(d)
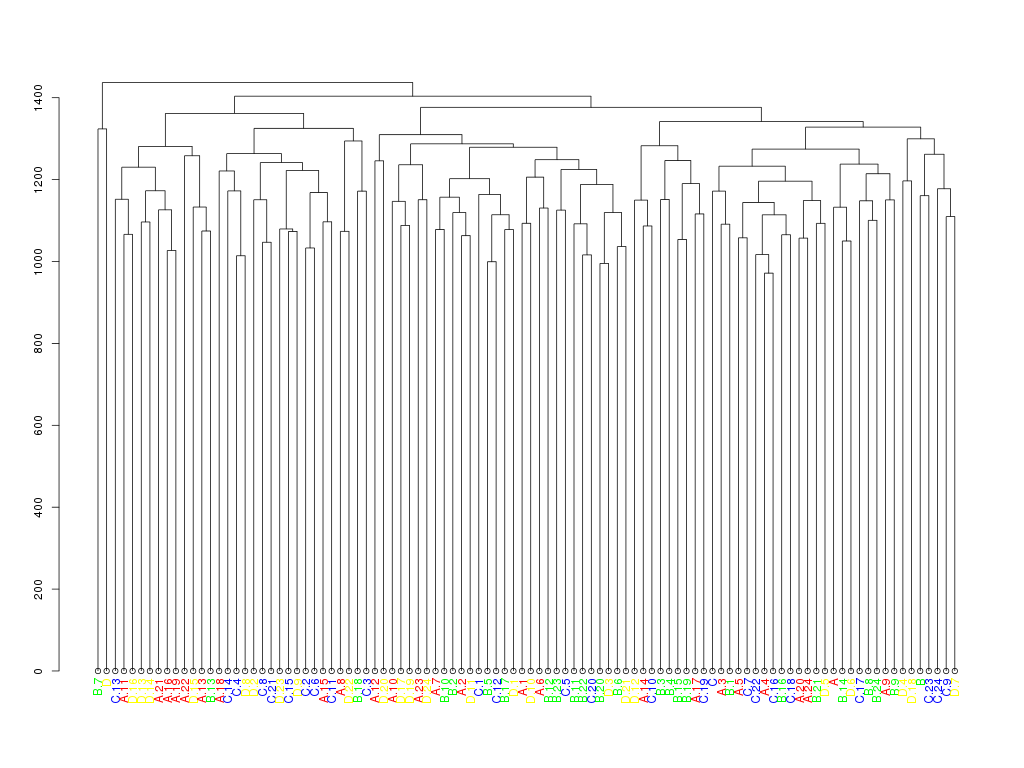
编辑:为最小示例添加代码:
    sample = data.frame(matrix(floor(abs(rnorm(20000)*100)),ncol=200))
groupCodes <- c(rep("A",25), rep("B",25), rep("C",25), rep("D",25))

## make unique rownames (equal rownames are not allowed)
rownames(sample) <- make.unique(groupCodes)

colorCodes <- c(A="red", B="green", C="blue", D="yellow")


## perform clustering
distSamples <- dist(sample)
hc <- hclust(distSamples)

## function to set label color
labelCol <- function(x) {
  if (is.leaf(x)) {
    ## fetch label
    label <- attr(x, "label")
    code <- substr(label, 1, 1)
    ## use the following line to reset the label to one letter code
    # attr(x, "label") <- code
    attr(x, "nodePar") <- list(lab.col=colorCodes[code])
  }
  return(x)
}

## apply labelCol on all nodes of the dendrogram
d <- dendrapply(as.dendrogram(hc), labelCol)

plot(d)
页面原文内容由Stack Overflow提供。腾讯云小微IT领域专用引擎提供翻译支持
原文链接:
https://stackoverflow.com/questions/18802519
复制相关文章
相似问题
腾讯云开发者

Copyright © 2013 - 2026 Tencent Cloud. All Rights Reserved. 腾讯云 版权所有
深圳市腾讯计算机系统有限公司 ICP备案/许可证号:粤B2-20090059 ![]() 粤公网安备44030502008569号
粤公网安备44030502008569号
腾讯云计算(北京)有限责任公司 京ICP证150476号 | 京ICP备11018762号