
自动生成用于线性模型上的ggfortify对象的交互式绘图
自动生成用于线性模型上的ggfortify对象的交互式绘图
提问于 2021-04-13 01:58:58
我试图根据基于这个ggfortify的多元回归模型为数据对象生成一个交互式的绘图。以下是我迄今所做的工作。如何使用ggfortify为此autoplotly对象生成交互式绘图?
library(ggfortify)
library(autoplotly)

# Construct a simple multivariate regression model
# So it's something like this SWE ~ Mean.Z + Intensity.mean

Model = lm(formula = SWE ~ Mean.Z + Intensity.mean, data = df.mean.swe)

# Plot the model
lm.plot = autoplot(Model, label.size = 3) + theme_bw()

# Interactive
autoplotly(lm.plot)

Error in unique.default(x) :
  unimplemented type 'expression' in 'HashTableSetup'
更新
好的,所以我可以通过首先指定fortify.Though感兴趣的图来解决这个问题,我不知道为什么错误现在消失了。
lm.plot = autoplot(Model, label.size = 3, which = 1:2) + theme_bw()
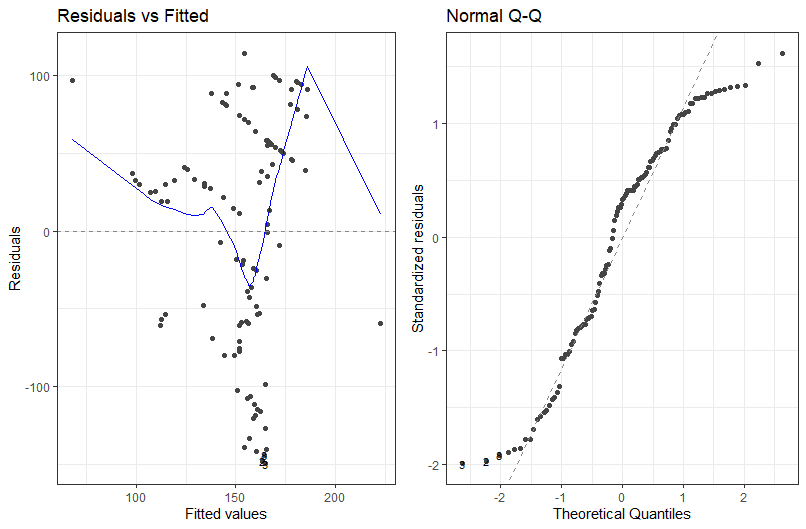
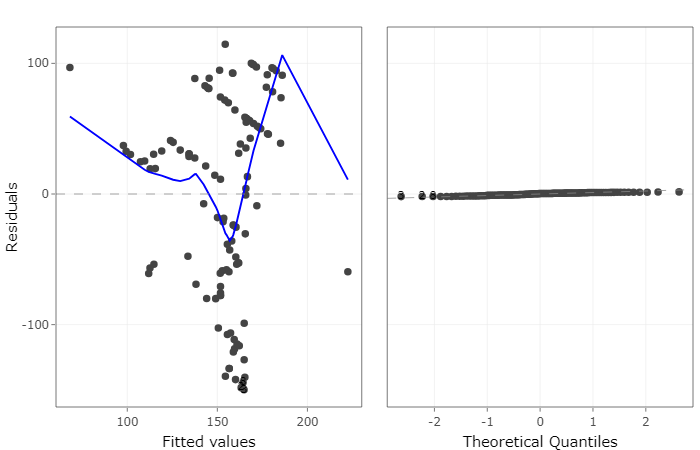
但是现在autoplotly没有正确地显示Q-Q图。
回答 1
Stack Overflow用户
发布于 2021-05-06 06:34:51
根据文档,shareY参数告诉函数是否在子图之间共享y轴。
试试这个:
autoplotly(lm.plot, shareY = FALSE)页面原文内容由Stack Overflow提供。腾讯云小微IT领域专用引擎提供翻译支持
原文链接:
https://stackoverflow.com/questions/67067767
复制相关文章
相似问题
腾讯云开发者

Copyright © 2013 - 2026 Tencent Cloud. All Rights Reserved. 腾讯云 版权所有
深圳市腾讯计算机系统有限公司 ICP备案/许可证号:粤B2-20090059 ![]() 粤公网安备44030502008569号
粤公网安备44030502008569号
腾讯云计算(北京)有限责任公司 京ICP证150476号 | 京ICP备11018762号