
聚类图添加集群号:函数fviz_cluster (因式分解)
聚类图添加集群号:函数fviz_cluster (因式分解)
提问于 2021-04-12 23:00:06
我有以下R码:
library(factoextra)

kms<-kmeans(df,18,nstart=100)

fviz_cluster(kms, data = df, alpha=0.2,shape=19,geom = "point")
它输出以下图片:
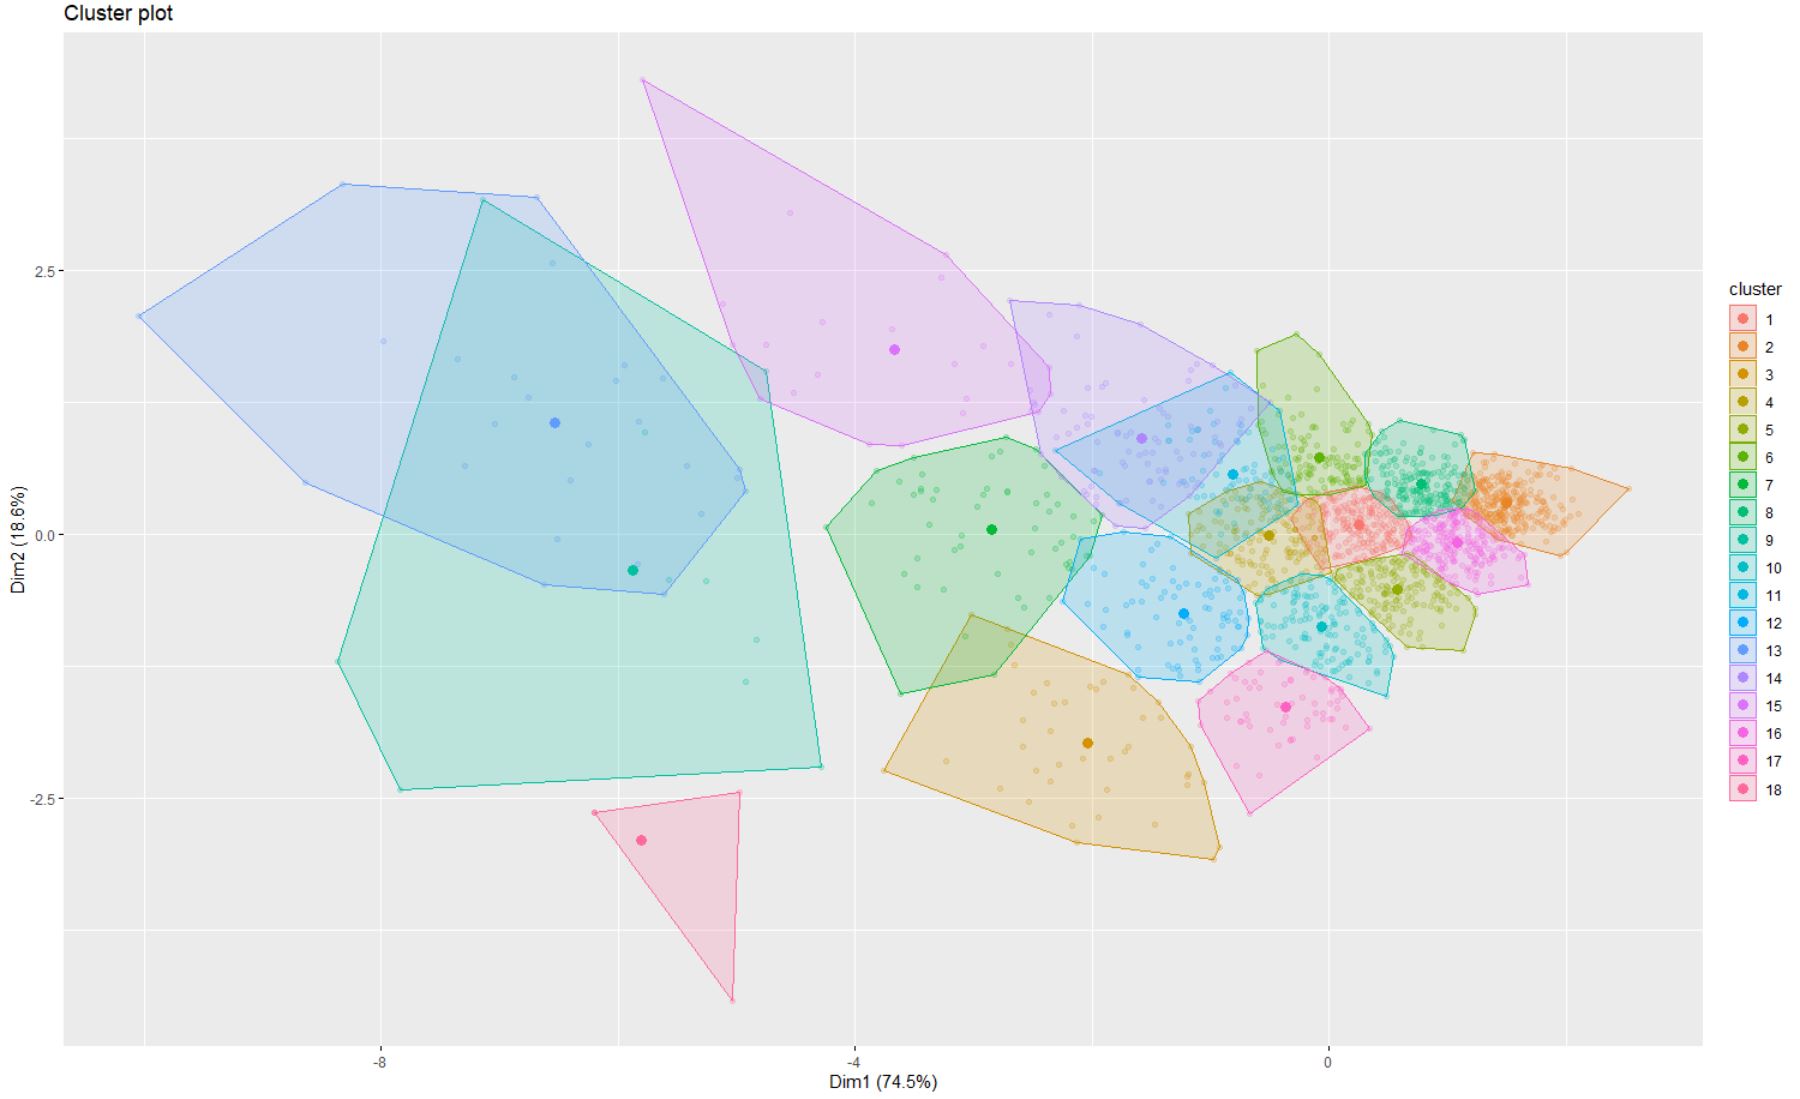
是否可以在图片中相应的集群中添加群集的数目?或者显示聚类数而不是点中心。
更新.
类似于我想要达到的目标,我发现在:https://www.r-bloggers.com/2016/11/hybrid-hierarchical-k-means-clustering-for-optimizing-clustering-outputs-unsupervised-machine-learning/
我试过了,但我错了。因此,我必须安装使用的factoextra版本,并更改代码。所以我得到了这个
fviz_cluster(kms, data = df,frame.level = 0.68)
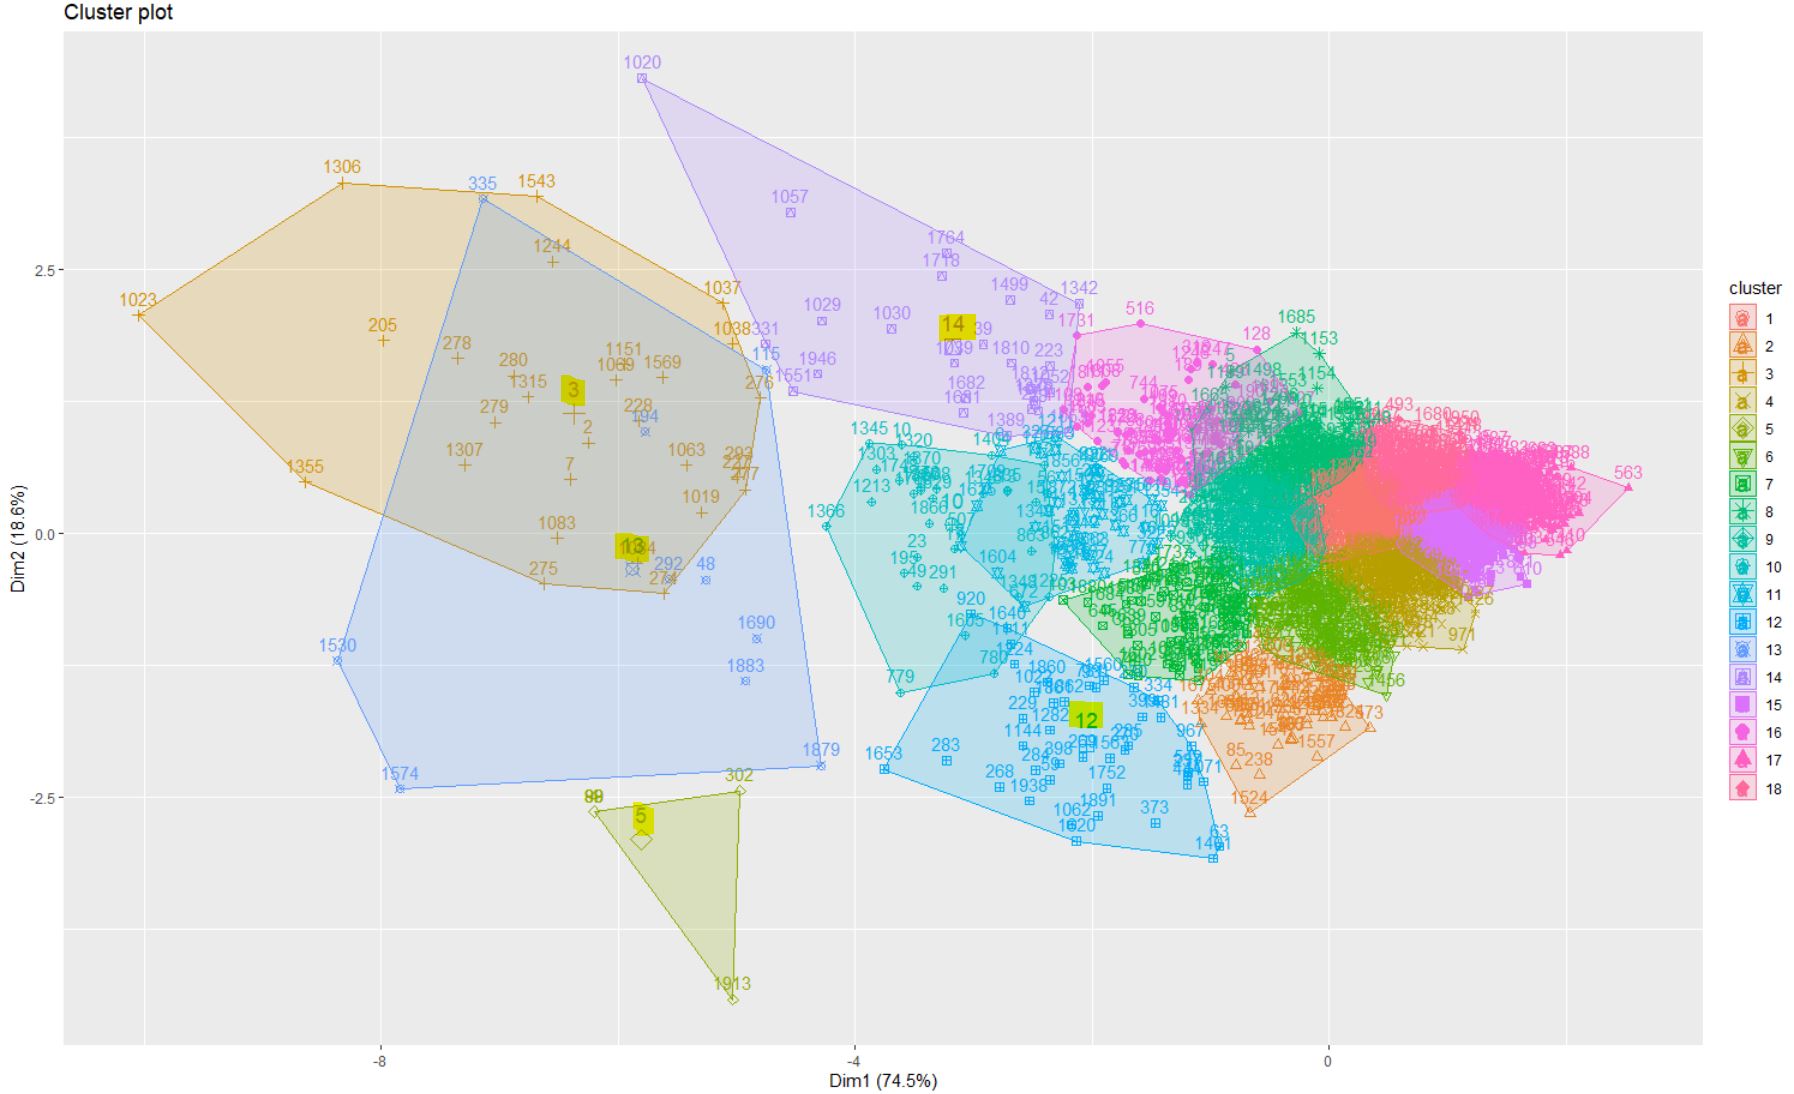
除了集群中心的数字外,我如何删除这些数字?
回答 1
Stack Overflow用户
发布于 2021-04-13 01:01:37
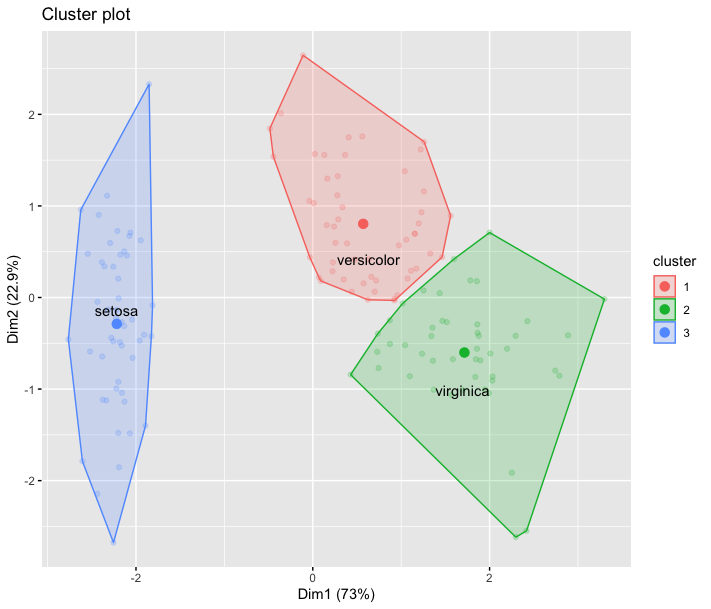
似乎没有简单的解决方案;下面是一个潜在的解决办法:
library(tidyverse)
library(factoextra)

data("iris")

# Select a single point for each category (i.e. setosa = the 25th value)
# label the selected value, then label the rest of the points with nothing ("")
iris$label <- c(rep("", 24), "setosa", rep("", 25),
                    rep("", 23), "versicolor", rep("", 26),
                    rep("", 24), "virginica", rep("", 25))


# Remove species column (5) and label column and scale the data
iris.scaled <- scale(iris[, -c(5,6)])

# K-means clustering
km.res <- kmeans(iris.scaled, 3, nstart = 10)

# Visualize clusters
fviz_cluster(km.res, iris[, -c(5,6)], alpha = 0.2, shape = 19, geom = c("point")) +
# Label the points (only the 3 with actual labels show up on the plot)
  geom_text(aes(label = iris$label))
页面原文内容由Stack Overflow提供。腾讯云小微IT领域专用引擎提供翻译支持
原文链接:
https://stackoverflow.com/questions/67066694
复制相关文章
相似问题
腾讯云开发者

Copyright © 2013 - 2026 Tencent Cloud. All Rights Reserved. 腾讯云 版权所有
深圳市腾讯计算机系统有限公司 ICP备案/许可证号:粤B2-20090059 ![]() 粤公网安备44030502008569号
粤公网安备44030502008569号
腾讯云计算(北京)有限责任公司 京ICP证150476号 | 京ICP备11018762号