
Tidymodel:在R中进行10倍交叉验证之后,从TIbble中取消RMSE和RSQ值以获得最佳拟合模型。
概述
我使用带有数据帧FID的tidymodel包生成了四种模型(参见下面的R代码)。
广义线性模型( Forest
- Boosted
- General Linear,glm)
- 袋装树
- 随机树
数据框架包含三个预测器
(numeric)
- Month (Factor)
- Days (数字)
因变量是频率(数值)
Aim
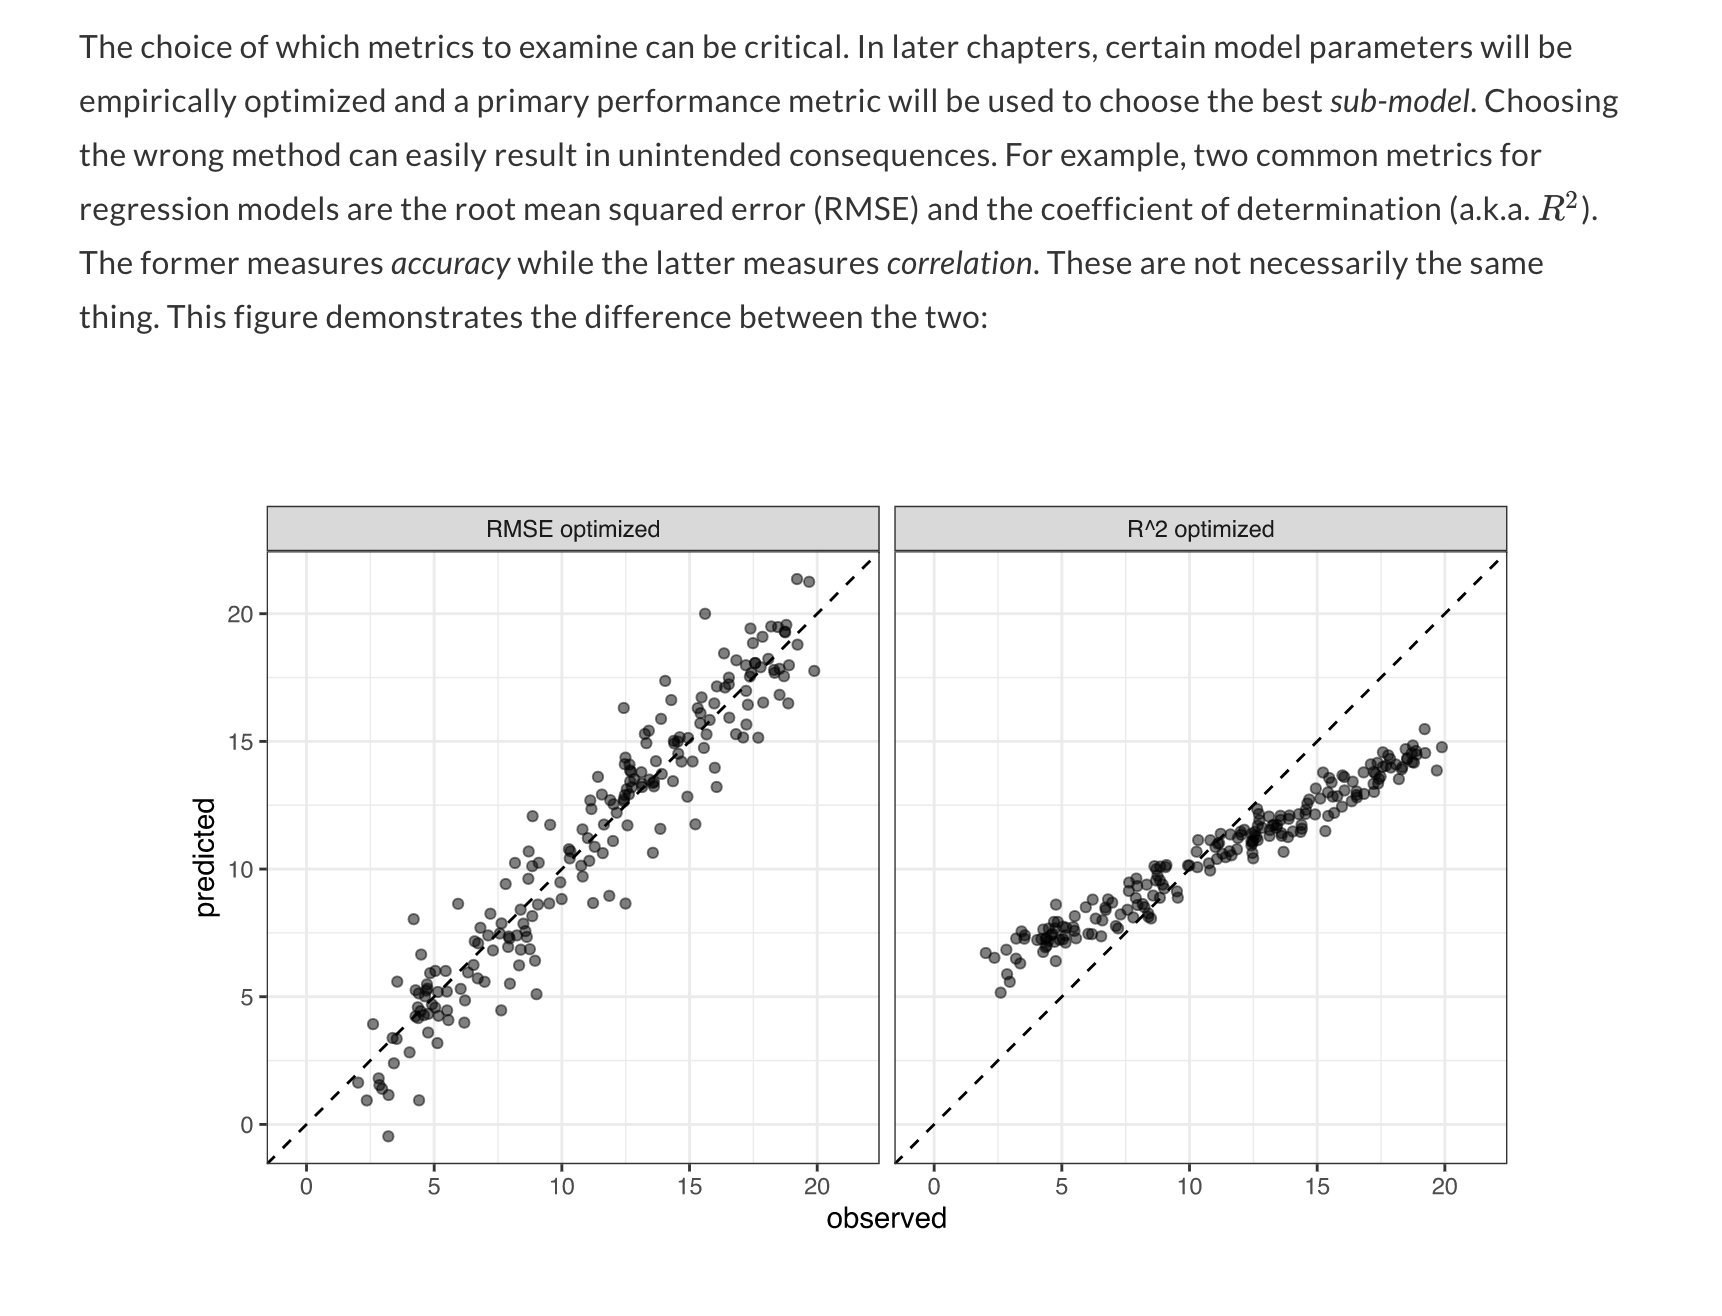
我的目标是取消最适合的模型(即glm、套袋树、随机森林、增强树),在对使用函数fit_samples().生成的tibble对象进行10倍交叉验证之后,显示出指标RMSE和RSQ。
的tibble示例
# Resampling results
# 10-fold cross-validation
# A tibble: 10 x 5
   splits         id     .metrics         .notes           .predictions
   <list>         <chr>  <list>           <list>           <list>
 1 <split [24/3]> Fold01 <tibble [2 × 3]> <tibble [0 × 1]> <tibble [3 × 3]>
 2 <split [24/3]> Fold02 <tibble [2 × 3]> <tibble [0 × 1]> <tibble [3 × 3]>
 3 <split [24/3]> Fold03 <tibble [2 × 3]> <tibble [0 × 1]> <tibble [3 × 3]>
 4 <split [24/3]> Fold04 <tibble [2 × 3]> <tibble [0 × 1]> <tibble [3 × 3]>
 5 <split [24/3]> Fold05 <tibble [2 × 3]> <tibble [0 × 1]> <tibble [3 × 3]>
 6 <split [24/3]> Fold06 <tibble [2 × 3]> <tibble [0 × 1]> <tibble [3 × 3]>
 7 <split [24/3]> Fold07 <tibble [2 × 3]> <tibble [0 × 1]> <tibble [3 × 3]>
 8 <split [25/2]> Fold08 <tibble [2 × 3]> <tibble [0 × 1]> <tibble [2 × 3]>
 9 <split [25/2]> Fold09 <tibble [2 × 3]> <tibble [0 × 1]> <tibble [2 × 3]>
10 <split [25/2]> Fold10 <tibble [2 × 3]> <tibble [0 × 1]> <tibble [2 × 3]>我想要可视化最好的模型(即glm,套袋树,随机森林,增强树)通过产生的地块,真值在x轴上,预测值在y轴上,如教程和图所示。
教程
https://www.tmwr.org/performance.html
当我试图使用函数predict()来预测测试数据上的拟合模型时,我继续在尝试1和尝试2中体验这些错误信息:-
错误消息-尝试1
 Error in UseMethod("predict") :
  no applicable method for 'predict' applied to an object of class "c('resample_results', 'tune_results', 'tbl_df', 'tbl', 'data.frame')"
错误消息-尝试2
Error: `...` is not empty.

We detected these problematic arguments:
* `..1`

These dots only exist to allow future extensions and should be empty.
Did you misspecify an argument?
问题
我的印象是,我必须先解开所有拟合模型(即glm、套袋树、随机森林、增强树)的RMSE和RSQ度量,然后才能对测试数据进行模型预测,以便对模型有效性进行评估,或者从10倍交叉验证期间检查的模型范围中从为拟合模型而创建的函数中取消最佳模型。
如果有人能够帮助我解决使用函数()预测拟合模型上的测试数据的问题,我将非常感激。如果不将真实值和观察到的值绑定到一个数据框架中,使用(),我就无法将RMSE和RSQ指标可视化在一个地块中。
在此之前,非常感谢您。
图
R-码
尝试1
    ##################################################
    ##Model Prediction
    ###################################################
    ##Open the tidymodels package
    library(tidymodels)
    library(tidyverse)
    library(glmnet)
    library(parsnip)
    library(rpart)
    library(tidyverse) # manipulating data
    library(skimr) # data visualization
    library(baguette) # bagged trees
    library(future) # parallel processing & decrease computation time
    library(xgboost) # boosted trees
    library(ranger)
    library(yardstick)
    library(purrr)
    library(forcats)

###########################################################
#split this single dataset into two: a training set and a testing set
data_split <- initial_split(FID)
# Create data frames for the two sets:
train_data <- training(data_split)
test_data  <- testing(data_split)

# resample the data with 10-fold cross-validation (10-fold by default)
cv <- vfold_cv(train_data, v=10)

###########################################################
##Produce the recipe

rec <- recipe(Frequency ~ ., data = FID) %>%
          step_nzv(all_predictors(), freq_cut = 0, unique_cut = 0) %>% # remove variables with zero variances
          step_novel(all_nominal()) %>% # prepares test data to handle previously unseen factor levels
          step_medianimpute(all_numeric(), -all_outcomes(), -has_role("id vars"))  %>% # replaces missing numeric observations with the median
          step_dummy(all_nominal(), -has_role("id vars")) # dummy codes categorical variables

###########################################################
##Create Models
###########################################################

##########################################################
##General Linear Models
#########################################################

##glm
mod_glm<-linear_reg(mode="regression",
                       penalty = 0.1,
                       mixture = 1) %>%
                            set_engine("glmnet")

##Create workflow
wflow_glm <- workflow() %>%
                add_recipe(rec) %>%
                      add_model(mod_glm)

##Fit the model
plan(multisession)

fit_glm <- fit_resamples(
                        wflow_glm,
                        cv,
                        metrics = metric_set(rmse, rsq),
                        control = control_resamples(save_pred = TRUE,
                              extract = function(x) extract_model(x)))

##########################################################
##Bagged Trees
##########################################################

#####Bagged Trees
mod_bag <- bag_tree() %>%
            set_mode("regression") %>%
              set_engine("rpart", times = 10) #10 bootstrap resamples


##Create workflow
wflow_bag <- workflow() %>%
                   add_recipe(rec) %>%
                       add_model(mod_bag)

##Fit the model
plan(multisession)

fit_bag <- fit_resamples(
                      wflow_bag,
                      cv,
                      metrics = metric_set(rmse, rsq),
                      control = control_resamples(save_pred = TRUE,
                              extract = function(x) extract_model(x)))
###################################################
##Random forests
###################################################

mod_rf <-rand_forest(trees = 1e3) %>%
                              set_engine("ranger",
                              num.threads = parallel::detectCores(),
                              importance = "permutation",
                              verbose = TRUE) %>%
                              set_mode("regression")

##Create Workflow

wflow_rf <- workflow() %>%
               add_model(mod_rf) %>%
                     add_recipe(rec)

##Fit the model

plan(multisession)

fit_rf<-fit_resamples(
             wflow_rf,
             cv,
             metrics = metric_set(rmse, rsq),
             control = control_resamples(save_pred = TRUE,
                                         extract = function(x) extract_model(x)))

############################################################
##Boosted Trees
############################################################

mod_boost <- boost_tree() %>%
                 set_engine("xgboost", nthreads = parallel::detectCores()) %>%
                      set_mode("regression")

##Create Workflow

wflow_boost <- workflow() %>%
                  add_recipe(rec) %>%
                    add_model(mod_boost)

##Fit model

plan(multisession)

fit_boost <-fit_resamples(
                       wflow_boost,
                       cv,
                       metrics = metric_set(rmse, rsq),
                       control = control_resamples(save_pred = TRUE,
                                         extract = function(x) extract_model(x)))
模型预测
###################################
##Model Prediction
####################################

  ##glm model

  test_res <- predict(fit_glm, new_data = test_data %>% select(-Frequency))

  ##Error Message

      Error in UseMethod("predict") :
  no applicable method for 'predict' applied to an object of class "c('resample_results', 'tune_results', 'tbl_df', 'tbl', 'data.frame')"

##Predicted numeric outcome from the regression model is named .pred. Let’s match
#the predicted values with their corresponding observed outcome values:

 bind_test_res <- bind_cols(test_res, test_data %>% select(Frequency))

#Note that both the predicted and observed outcomes are in log10 units.
#It is best practice to analyze the predictions on the transformed scale
#(if one were used) even if the predictions are reported using the original units.使用():绘制数据
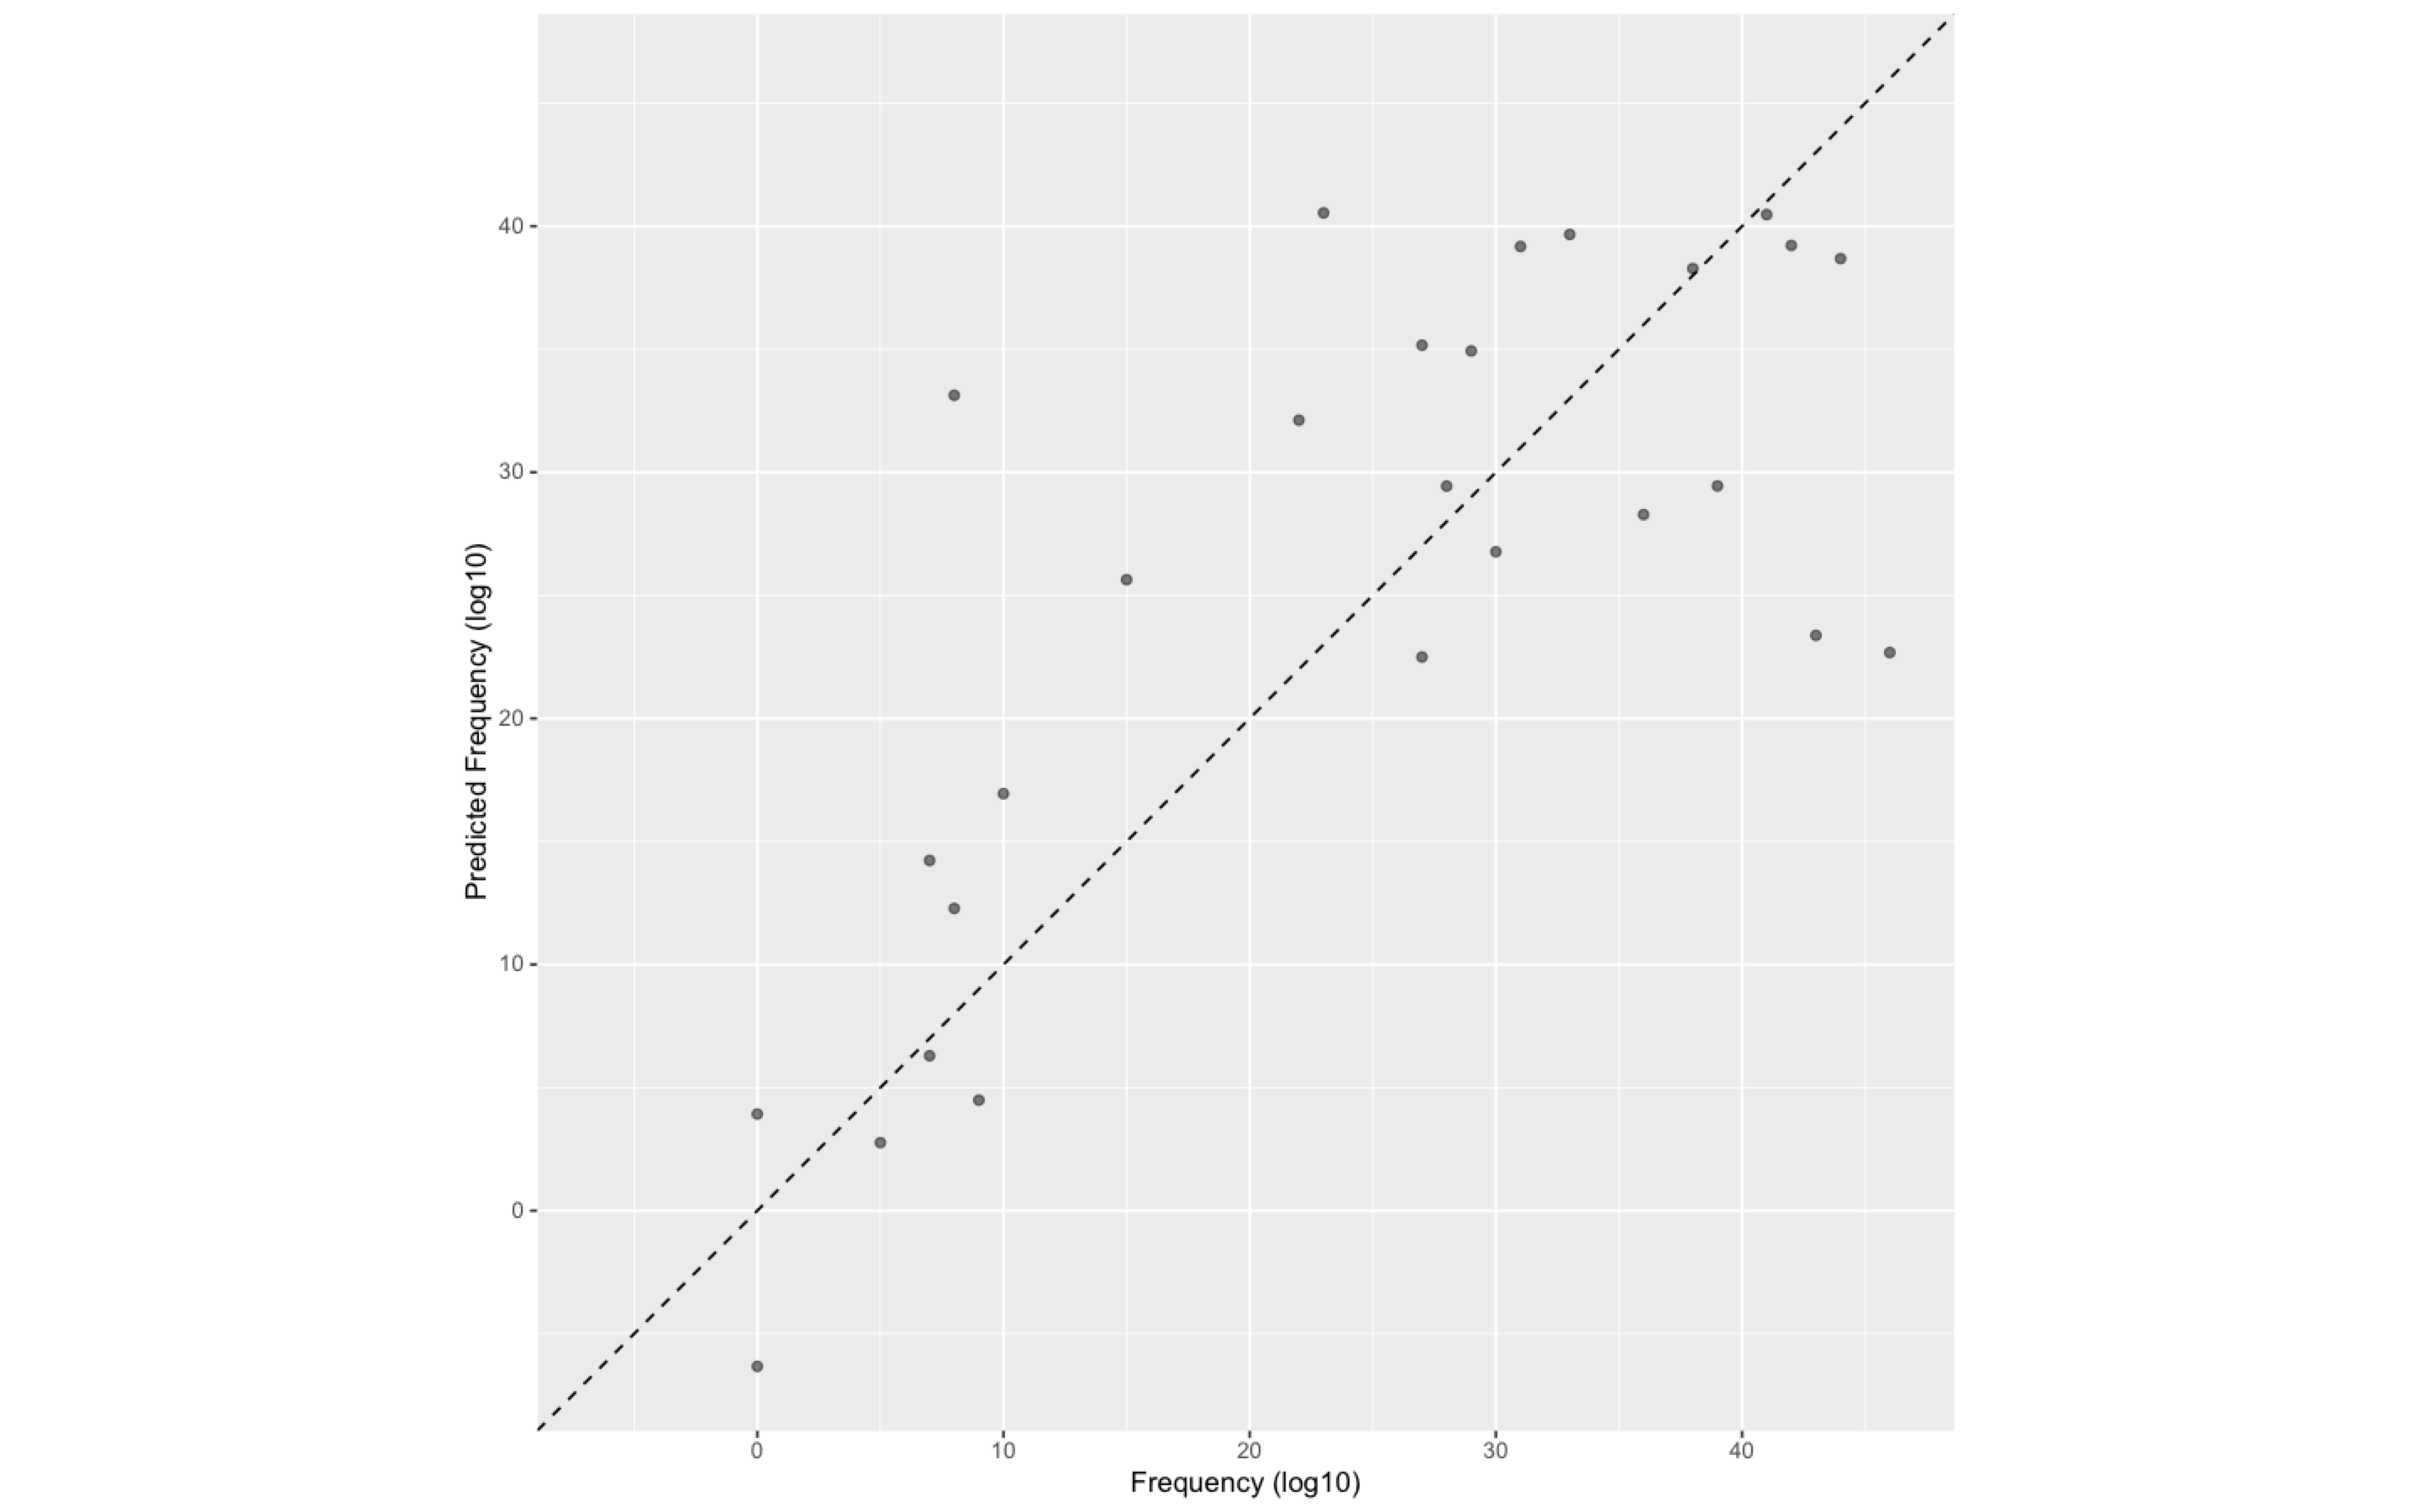
 ggplot(bind_test_res, aes(x = Frequency, y = .pred)) +
         # Create a diagonal line:
  geom_abline(lty = 2) +
  geom_point(alpha = 0.5) +
  labs(y = "Predicted Frequency (log10)", x = "Frequency (log10)") +
  # Scale and size the x- and y-axis uniformly:
  coord_obs_pred()
尝试2
##split this single dataset into two: a training set and a testing set
data_split <- initial_split(FID)
# Create data frames for the two sets:
train_data <- training(data_split)
test_data  <- testing(data_split)

##Produce the recipe

rec <- recipe(Frequency ~ ., data = FID) %>%
          step_nzv(all_predictors(), freq_cut = 0, unique_cut = 0) %>% # remove variables with zero variances
          step_novel(all_nominal()) %>% # prepares test data to handle previously unseen factor levels
          step_medianimpute(all_numeric(), -all_outcomes(), -has_role("id vars"))  %>% # replaces missing numeric observations with the median
          step_dummy(all_nominal(), -has_role("id vars")) # dummy codes categorical variables

# resample the data with 10-fold cross-validation (10-fold by default)
cv <- vfold_cv(train_data, v=10)

Run our models
# Extract our prepped training data
# and "bake" our testing data

prep<-prep(rec)

training_baked<-juice(prep)

testing_baked <- prep %>% bake(test_data)

##glm model
glm_model<-linear_reg(mode="regression",
                      penalty = 0.1,
                      mixture = 1) %>%
                      set_engine("glmnet")


##Create workflow
wflow_glm <- workflow() %>%
                 add_recipe(prep) %>%
                         add_model(glm_model)

##fit the model
fit_glm<- wflow_glm %>% fit(Frequency~Year+Month+Days, data=FID)

##Error Message

Error: `...` is not empty.

We detected these problematic arguments:
* `..1`

These dots only exist to allow future extensions and should be empty.
Did you misspecify an argument?
数据帧- FID
structure(list(Year = c(2015, 2015, 2015, 2015, 2015, 2015, 2015,
2015, 2015, 2015, 2015, 2015, 2016, 2016, 2016, 2016, 2016, 2016,
2016, 2016, 2016, 2016, 2016, 2016, 2017, 2017, 2017, 2017, 2017,
2017, 2017, 2017, 2017, 2017, 2017, 2017), Month = structure(c(1L,
2L, 3L, 4L, 5L, 6L, 7L, 8L, 9L, 10L, 11L, 12L, 1L, 2L, 3L, 4L,
5L, 6L, 7L, 8L, 9L, 10L, 11L, 12L, 1L, 2L, 3L, 4L, 5L, 6L, 7L,
8L, 9L, 10L, 11L, 12L), .Label = c("January", "February", "March",
"April", "May", "June", "July", "August", "September", "October",
"November", "December"), class = "factor"), Frequency = c(36,
28, 39, 46, 5, 0, 0, 22, 10, 15, 8, 33, 33, 29, 31, 23, 8, 9,
7, 40, 41, 41, 30, 30, 44, 37, 41, 42, 20, 0, 7, 27, 35, 27,
43, 38), Days = c(31, 28, 31, 30, 6, 0, 0, 29, 15,
29, 29, 31, 31, 29, 30, 30, 7, 0, 7, 30, 30, 31, 30, 27, 31,
28, 30, 30, 21, 0, 7, 26, 29, 27, 29, 29)), row.names = c(NA,
-36L), class = "data.frame")回答 1
Stack Overflow用户
发布于 2020-12-14 11:02:05
这个答案是由Max Khun启发的
#split this single dataset into two: a training set and a testing set
data_split <- initial_split(FID)
# Create data frames for the two sets:
train_data <- training(data_split)
test_data  <- testing(data_split)

# resample the data with 10-fold cross-validation (10-fold by default)
cv <- vfold_cv(train_data, v=10)

###########################################################
##Produce the recipe

rec <- recipe(Frequency ~ ., data = FID) %>%
          step_nzv(all_predictors(), freq_cut = 0, unique_cut = 0) %>% # remove variables with zero variances
          step_novel(all_nominal()) %>% # prepares test data to handle previously unseen factor levels
          step_medianimpute(all_numeric(), -all_outcomes(), -has_role("id vars"))  %>% # replaces missing numeric observations with the median
          step_dummy(all_nominal(), -has_role("id vars")) # dummy codes categorical variables

##########################################################
##Produce Models
##########################################################
##General Linear Models
##########################################################

##Produce the glm model
mod_glm<-linear_reg(mode="regression",
                       penalty = 0.1,
                       mixture = 1) %>%
                            set_engine("glmnet")

##Create workflow
wflow_glm <- workflow() %>%
                add_recipe(rec) %>%
                      add_model(mod_glm)

#######################################################################
##MODEL EVALUATION
#######################################################################
##Estimate how well that model performs, let’s fit many times,
##once to each of these resampled folds, and then evaluate on the heldout
##part of each resampled fold.
##########################################################################
plan(multisession)

fit_glm <- fit_resamples(
                        wflow_glm,
                        cv,
                        metrics = metric_set(rmse, rsq),
                        control = control_resamples(save_pred = TRUE)
                        )

##Collect model predictions for each fold for the predictor frequency

Predictions<-fit_glm %>%
                    collect_predictions()

##Produce a data frame of the Predictions model

Prediction<-as.data.frame(Predictions)

##Open a new plotting window
dev.new()

##Visualise the data by plotting the predicted vs true values
ggplot(Prediction, aes(x = Frequency, y = .pred)) +
  # Create a diagonal line:
  geom_abline(lty = 2) +
  geom_point(alpha = 0.5) +
  labs(y = "Predicted Frequency (log10)", x = "Frequency (log10)") +
  # Scale and size the x- and y-axis uniformly:
  coord_obs_pred()
图
https://stackoverflow.com/questions/65032613
复制相似问题
腾讯云开发者

Copyright © 2013 - 2026 Tencent Cloud. All Rights Reserved. 腾讯云 版权所有
深圳市腾讯计算机系统有限公司 ICP备案/许可证号:粤B2-20090059 ![]() 粤公网安备44030502008569号
粤公网安备44030502008569号
腾讯云计算(北京)有限责任公司 京ICP证150476号 | 京ICP备11018762号