
R中的双向方差分析与箱形图分析
R中的双向方差分析与箱形图分析
提问于 2019-10-10 17:03:31
我遵循这个教程和这个问题1,问题2来绘制一个双向方框图,用小面和字母来表示治疗之间的静态差异。有人知道如何绘制这种图形吗?
关于我的尝试的一些代码:
    library(multcompView)
    library(ggplot2)
    #sample dataframe
    data <- structure(list(nozzle = c("XR", "XR", "XR", "XR", "XR", "XR", "XR", "XR",
                                      "XR", "XR", "XR", "XR", "XR", "XR", "XR", "XR",
                                      "AIXR", "AIXR", "AIXR", "AIXR", "AIXR", "AIXR",
                                      "AIXR", "AIXR", "AIXR", "AIXR", "AIXR", "AIXR",
                                      "AIXR", "AIXR", "AIXR", "AIXR"),
                           trat = c("Cle 12.8", "Cle 12.8", "Cle 12.8", "Cle 12.8",
                                    "Cle 34", "Cle 34", "Cle 34", "Cle 34", "Cle 12.8",
                                    "Cle 12.8", "Cle 12.8", "Cle 12.8", "Cle 34", "Cle 34",
                                    "Cle 34", "Cle 34", "Cle 12.8", "Cle 12.8", "Cle 12.8",
                                    "Cle 12.8", "Cle 34", "Cle 34", "Cle 34", "Cle 34",
                                    "Cle 12.8", "Cle 12.8", "Cle 12.8", "Cle 12.8", "Cle 34",
                                    "Cle 34", "Cle 34", "Cle 34"),
                           adj = c("Without", "Without", "Without", "Without", "Without",
                                   "Without", "Without", "Without", "With", "With", "With",
                                   "With", "With", "With", "With", "With", "Without", "Without",
                                   "Without", "Without", "Without", "Without", "Without", "Without",
                                   "With", "With", "With", "With", "With", "With", "With", "With"),
                           dw1 = c(3.71, 5.87, 6.74, 1.65, 0.27, 0.4, 0.37, 0.34, 0.24, 0.28, 0.32,
                                   0.38, 0.39, 0.36, 0.32, 0.28, 8.24, 10.18, 11.59, 6.18, 0.2, 0.23,
                                   0.2, 0.31, 0.28, 0.25, 0.36, 0.27, 0.36, 0.37, 0.34, 0.19)), row.names = c(NA, -32L), class = c("tbl_df", "tbl", "data.frame"))

    #function
    generate_label_df <- function(TUKEY, variable){

      # Extract labels and factor levels from Tukey post-hoc
      Tukey.levels <- variable[,4]
      Tukey.labels <- data.frame(multcompLetters(Tukey.levels)['Letters'])

      #I need to put the labels in the same order as in the boxplot :
      Tukey.labels$treatment=rownames(Tukey.labels)
      Tukey.labels=Tukey.labels[order(Tukey.labels$treatment) , ]
      return(Tukey.labels)
    }

    # What is the effect of the treatment on the value ?
model=lm( data$dw1~ data$trat:data$adj )
ANOVA=aov(model)

# Tukey test to study each pair of treatment :
TUKEY <- TukeyHSD(x=ANOVA, 'data$trat', conf.level=0.95)

# Tuckey test representation :
plot(TUKEY , las=1 , col="brown")

p <- ggplot(data=data, aes(x=trat , y=dw1, fill=adj)) +
      geom_boxplot(outlier.shape=NA) +
      facet_grid(~nozzle) +
      scale_fill_brewer(palette="Reds") +
      theme_minimal() +
      theme(legend.position="none") +
      theme(axis.text.x=element_text(angle=45, hjust=1))

    for (facetk in as.character(unique(data$nozzle))) {
      subdf <- subset(data, as.array(nozzle==facetk))
      model=lm(dw1 ~ trat:adj, data=subdf)
      ANOVA=aov(model)
      TUKEY <- TukeyHSD(ANOVA)

      labels <- generate_label_df(TUKEY , TUKEY$`trat:adj`)
      names(labels) <- c('Letters','trat')
      yvalue <- aggregate(.~nozzle, data=subdf, quantile, probs=0.75)
      final <- merge(labels, yvalue)
      final$nozzle <-  facetk

      p <- p + geom_text(data = final,  aes(x=trat, y=value_y, label=Letters),
                         vjust=-1.5, hjust=-.5)
    }
    p
我得到了这个错误
Quantile.default中的错误(X[i],.):不允许因素
我知道我必须把数字,不是因子的分位数,但我不知道我是否修正了这个错误,它会出现在我的图表中的字母。
回答 1
Stack Overflow用户
回答已采纳
发布于 2019-10-10 17:38:44
data <- structure(list(nozzle = c("XR", "XR", "XR", "XR", "XR", "XR", "XR", "XR",
"XR", "XR", "XR", "XR", "XR", "XR", "XR", "XR",
"AIXR", "AIXR", "AIXR", "AIXR", "AIXR", "AIXR",
"AIXR", "AIXR", "AIXR", "AIXR", "AIXR", "AIXR",
"AIXR", "AIXR", "AIXR", "AIXR"),
trat = c("Cle 12.8", "Cle 12.8", "Cle 12.8", "Cle 12.8",
"Cle 34", "Cle 34", "Cle 34", "Cle 34", "Cle 12.8",
"Cle 12.8", "Cle 12.8", "Cle 12.8", "Cle 34", "Cle 34",
"Cle 34", "Cle 34", "Cle 12.8", "Cle 12.8", "Cle 12.8",
"Cle 12.8", "Cle 34", "Cle 34", "Cle 34", "Cle 34",
"Cle 12.8", "Cle 12.8", "Cle 12.8", "Cle 12.8", "Cle 34",
"Cle 34", "Cle 34", "Cle 34"),
adj = c("Without", "Without", "Without", "Without", "Without",
"Without", "Without", "Without", "With", "With", "With",
"With", "With", "With", "With", "With", "Without", "Without",
"Without", "Without", "Without", "Without", "Without", "Without",
"With", "With", "With", "With", "With", "With", "With", "With"),
dw1 = c(3.71, 5.87, 6.74, 1.65, 0.27, 0.4, 0.37, 0.34, 0.24, 0.28, 0.32,
0.38, 0.39, 0.36, 0.32, 0.28, 8.24, 10.18, 11.59, 6.18, 0.2, 0.23,
0.2, 0.31, 0.28, 0.25, 0.36, 0.27, 0.36, 0.37, 0.34, 0.19)), row.names = c(NA, -32L), class = c("tbl_df", "tbl", "data.frame"))
data$trat_adj<-paste(data$trat,data$adj,sep = "_")
data<-as.data.frame(data[-c(2,3)])
str(data)
#function
generate_label_df <- function(TUKEY, variable){
# Extract labels and factor levels from Tukey post-hoc
Tukey.levels <- variable[,4]
Tukey.labels <- data.frame(multcompLetters(Tukey.levels)['Letters'])
#I need to put the labels in the same order as in the boxplot :
Tukey.labels$treatment=rownames(Tukey.labels)
Tukey.labels=Tukey.labels[order(Tukey.labels$treatment) , ]
return(Tukey.labels)
}
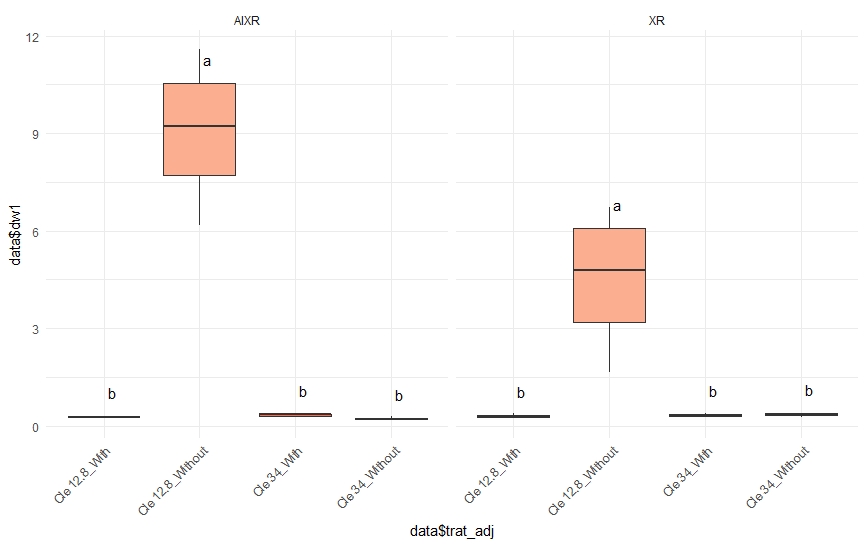
p <- ggplot(data=data, aes(x=data$trat_adj, y=data$dw1, fill=data$trat_adj)) +
geom_boxplot(outlier.shape=NA) +
facet_grid(~nozzle) +
scale_fill_brewer(palette="Reds") +
theme_minimal() +
theme(legend.position="none") +
theme(axis.text.x=element_text(angle=45, hjust=1))
p
for (facetk in as.character(unique(data$nozzle))) {
subdf <- subset(data, nozzle==facetk)
model=lm(dw1 ~ trat_adj, data=subdf)
ANOVA=aov(model)
TUKEY <- TukeyHSD(ANOVA)
labels <- generate_label_df(TUKEY, TUKEY$trat_adj)
names(labels) <- c('Letters','data$trat_adj')
yvalue <- aggregate(subdf$dw1, list(subdf$trat_adj), data=subdf, quantile, probs=.75)
final <- data.frame(labels, yvalue[,2])
names(final)<-c("letters","trat_adj","dw1")
final$nozzle <- facetk
p <- p + geom_text(data = final, aes(x=trat_adj, y=dw1, fill=trat_adj,label=letters),
vjust=-1.5, hjust=-.5)
}
p
页面原文内容由Stack Overflow提供。腾讯云小微IT领域专用引擎提供翻译支持
原文链接:
https://stackoverflow.com/questions/58327852
复制相关文章
相似问题
腾讯云开发者

Copyright © 2013 - 2026 Tencent Cloud. All Rights Reserved. 腾讯云 版权所有
深圳市腾讯计算机系统有限公司 ICP备案/许可证号:粤B2-20090059 ![]() 粤公网安备44030502008569号
粤公网安备44030502008569号
腾讯云计算(北京)有限责任公司 京ICP证150476号 | 京ICP备11018762号