
在R中,为什么我要得到“固定杠杆:残差对因子水平”而不是“残差比杠杆”?
在R中,为什么我要得到“固定杠杆:残差对因子水平”而不是“残差比杠杆”?
提问于 2020-07-20 17:39:24
回答 1
Stack Overflow用户
回答已采纳
发布于 2020-07-21 08:41:19
没有一个可重复的例子,我将首先创建一个基于内置数据集iris的模型。
df1 <- iris[1:100, 3:5]
df1$Species <- droplevels(df1$Species)
str(df1)
#'data.frame':   100 obs. of  3 variables:
# $ Petal.Length: num  1.4 1.4 1.3 1.5 1.4 1.7 1.4 1.5 1.4 1.5 ...
# $ Petal.Width : num  0.2 0.2 0.2 0.2 0.2 0.4 0.3 0.2 0.2 0.1 ...
# $ Species     : Factor w/ 2 levels "setosa","versicolor": 1 1 1 1 1 1 1 1 1 1 ...
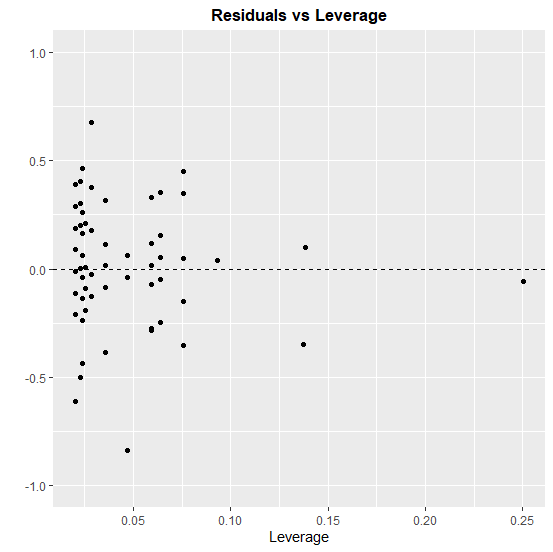
fit <- lm(Petal.Length ~ Petal.Width*Species, df1)至于图,autoplot是一个泛型函数。包ggfortify包括类"lm"对象的方法等。
来自help("autoplot.lm")
如果需要地块的子集,则指定数字1:6的子集。
默认情况是which = c(1, 2, 3, 5)。通过对参数的所有6个值的尝试,我们发现所需的图并不是其中之一。因此,需要建立一个自定义图。
剩余值和杠杆值分别可以从stats::resid和stats::hatvalues获得。
library(ggplot2)

dflev <- data.frame(Leverage = hatvalues(fit), y = resid(fit))

ggplot(dflev, aes(Leverage, y)) +
  geom_point() +
  geom_hline(yintercept = 0, linetype = "dashed") +
  ggtitle("Residuals vs Leverage") +
  lims(y = c(-1, 1)) +
  ylab("") +
  theme(plot.title = element_text(hjust = 0.5, face = "bold"))
页面原文内容由Stack Overflow提供。腾讯云小微IT领域专用引擎提供翻译支持
原文链接:
https://stackoverflow.com/questions/63000992
复制相关文章
相似问题
腾讯云开发者

Copyright © 2013 - 2026 Tencent Cloud. All Rights Reserved. 腾讯云 版权所有
深圳市腾讯计算机系统有限公司 ICP备案/许可证号:粤B2-20090059 ![]() 粤公网安备44030502008569号
粤公网安备44030502008569号
腾讯云计算(北京)有限责任公司 京ICP证150476号 | 京ICP备11018762号