
如何在R中寻找两个连续变量之间的有意义边界
为了找出虹膜数据集的两列之间的关系,我正在执行kruskal.test,p.value显示了这两列之间有意义的关系。
data(iris)
kruskal.test(iris$Petal.Length, iris$Sepal.Width)
以下是研究结果:
    Kruskal-Wallis rank sum test

data:  iris$Petal.Length and iris$Sepal.Width
Kruskal-Wallis chi-squared = 41.827, df = 22, p-value = 0.00656散点图也显示了某种关系。plot(iris$Petal.Length, iris$Petal.Width)
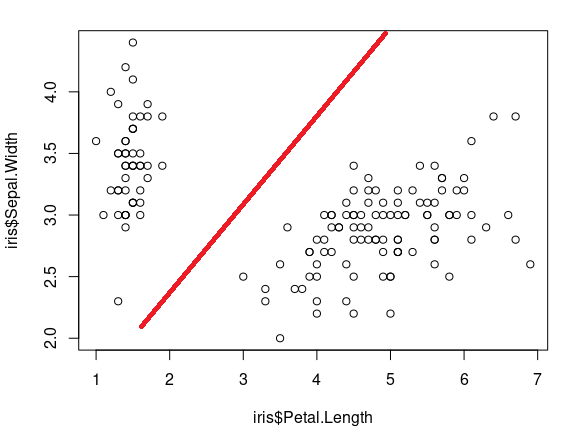
为了找到这两个变量的有意义的边界,我运行了pairwise.wilcox.test测试,但是要使这个测试正常工作,其中一个变量需要是绝对的。如果我把两个连续变量都传递给它,结果就不像预期的那样。
pairwise.wilcox.test(x = iris$Petal.Length, g = iris$Petal.Width, p.adjust.method = "BH")作为输出,我需要一个明确的切点,其中这两个变量有某种关系,这种关系结束的地方(如上图中的红线所示)。
我不确定是否有任何统计测试或其他编程技术来找到这些边界。
我可以做这样的事情来标记边界-
setDT(iris)[, relationship := ifelse(Petal.Length > 3 & Sepal.Width < 3.5, 1, 0)]但是,在R中是否有一种编程技术或库来寻找这样的边界?
重要的是要注意,我的实际数据是扭曲的。
谢谢你,索拉布
回答 1
Stack Overflow用户
发布于 2020-09-22 18:22:25
没有什么是最好的分裂。在您指定的某些条件/标准下,它可能是最好的。
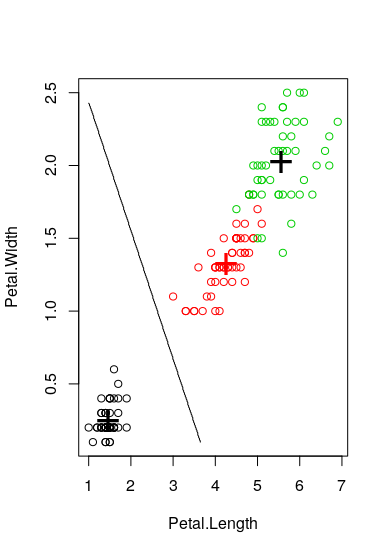
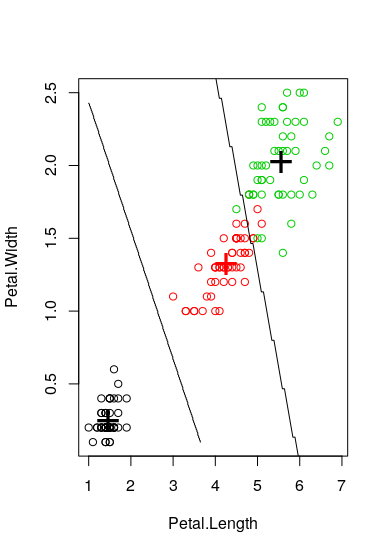
我想你期待的第二个情节,虽然我也增加了第一个,其中你有一行。本文采用线性判别分析方法。然而,这是监督学习,因为我们有物种栏。所以你可能对没有监督的方法感兴趣,比如K--最近的邻域和边界--然后检查一下这个https://stats.stackexchange.com/questions/21572/how-to-plot-decision-boundary-of-a-k-nearest-neighbor-classifier-from-elements-o。
data(iris)
library(MASS)

plot(iris$Petal.Length, iris$Petal.Width, col = iris$Species)

# construct the model
mdl <- lda(Species ~ Petal.Length + Petal.Width, data = iris)

# draw discrimination line
np <- 300
nd.x <- seq(from = min(iris$Petal.Length), to = max( iris$Petal.Length), length.out = np)
nd.y <- seq(from = min(iris$Petal.Width), to = max( iris$Petal.Width), length.out = np)
nd <- expand.grid(Petal.Length = nd.x, Petal.Width = nd.y)

prd <- as.numeric(predict(mdl, newdata = nd)$class)

plot(iris[, c("Petal.Length", "Petal.Width")], col = iris$Species)
points(mdl$means, pch = "+", cex = 3, col = c("black", "red"))
contour(x = nd.x, y = nd.y, z = matrix(prd, nrow = np, ncol = np),
        levels = c(1, 2), add = TRUE, drawlabels = FALSE)

#create LD sequences from min - max values
p = predict(mdl, newdata= nd)
p.x = seq(from = min(p$x[,1]), to = max(p$x[,1]), length.out = np) #LD1 scores
p.y = seq(from = min(p$x[,2]), to = max(p$x[,2]), length.out = np) #LD2 scores


contour(x = p.x, y = p.y, z = matrix(prd, nrow = np, ncol = np),
        levels = c(1, 2, 3), add = TRUE, drawlabels = FALSE)
链接到:How to plot classification borders on an Linear Discrimination Analysis plot in R
https://stackoverflow.com/questions/64014014
复制相似问题
腾讯云开发者

Copyright © 2013 - 2026 Tencent Cloud. All Rights Reserved. 腾讯云 版权所有
深圳市腾讯计算机系统有限公司 ICP备案/许可证号:粤B2-20090059 ![]() 粤公网安备44030502008569号
粤公网安备44030502008569号
腾讯云计算(北京)有限责任公司 京ICP证150476号 | 京ICP备11018762号