
如何处理谱图图中缺少的输入?
如何处理谱图图中缺少的输入?
提问于 2021-01-08 07:16:04
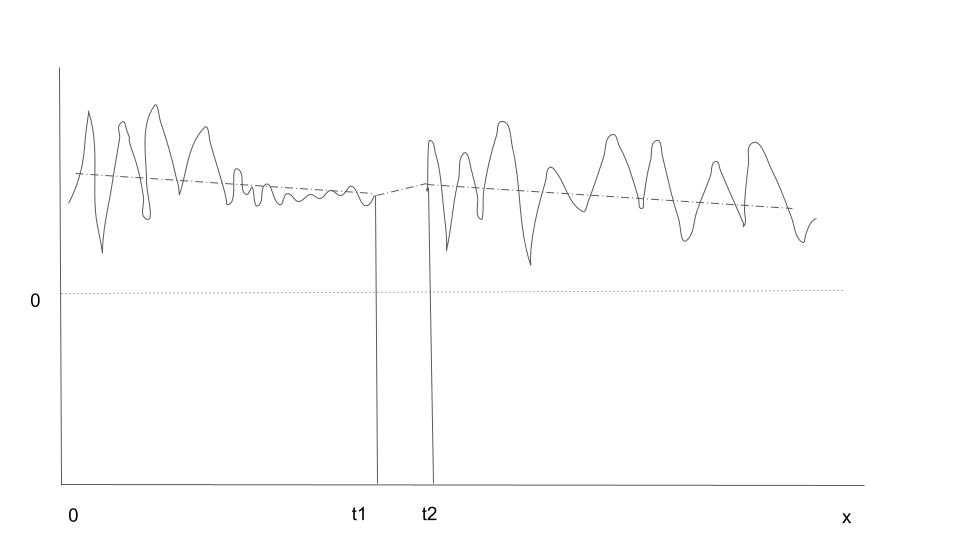
我试图用python包:scipy.signal.spectrogram.绘制一个信号的谱图。
如果我的输入信号在某个时间段(t1 - t2)丢失了数据(如所附图像所示),那么我的查询是什么?
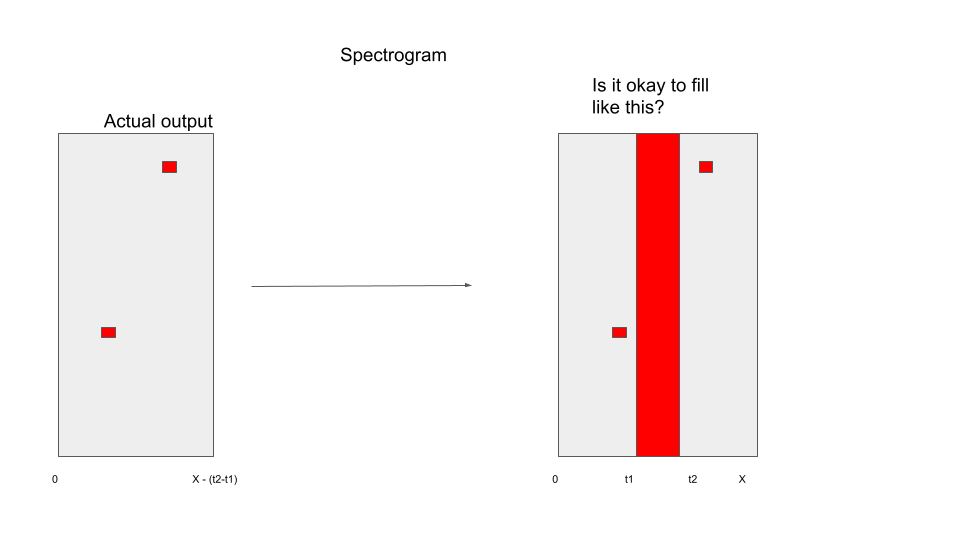
- 即使输入有以上所示的缺失部分,也可以将数据传递给谱图计算吗?或
- (很明显,这个缺失的输入时间周期反映在谱图输出中)在计算谱图之后,可以通过外部处理来填充该缺失时间周期的最小值吗?
回答 1
Stack Overflow用户
发布于 2021-01-08 11:06:05
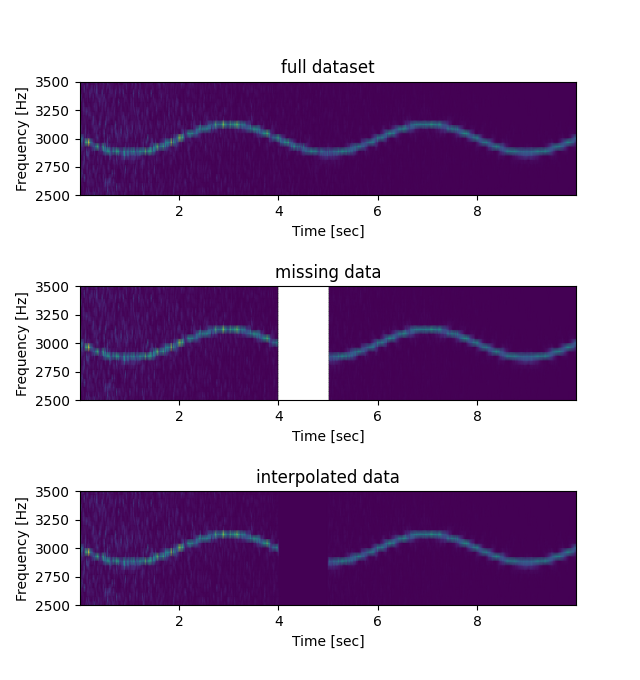
我要说的是,使用缺失部分的数据或插值数据集都是没有问题的。应该提到的是,数据的某些部分是内插的,以避免误解。因此,非插值数据集将是“更显式”的数据集。
我对枕骨的例子进行了修改,以显示评估期间丢失的数据的效果,以及插值的效果:
from scipy import signal
import matplotlib.pyplot as plt
import numpy as np

fig = plt.figure()
ax1 = fig.add_subplot(311)
ax2 = fig.add_subplot(312)
ax3 = fig.add_subplot(313)

def get_spectro(x, fs, ax, title):
    f, t, Sxx = signal.spectrogram(x, fs)
    ax.pcolormesh(t, f, Sxx, shading='gouraud')
    ax.set_ylabel('Frequency [Hz]')
    ax.set_xlabel('Time [sec]')
    ax.set_ylim((2500, 3500))
    ax.set_title(title)


# get oscillating frequency
fs = 10e3
N = 1e5
amp = 2 * np.sqrt(2)
noise_power = 0.01 * fs / 2
time = np.arange(N) / float(fs)
mod = 500 * np.cos(2 * np.pi * 0.25 * time)
carrier = amp * np.sin(2 * np.pi * 3e3 * time + mod)
noise = np.random.normal(scale=np.sqrt(noise_power), size=time.shape)
noise *= np.exp(-time / 5)
x = carrier + noise
get_spectro(x, fs, ax1, 'full dataset')

# replace middle part by nan
x[40000:50000] = np.nan
get_spectro(x, fs, ax2, 'missing data')

# interpolate the missing section linearly
x[np.isnan(x)] = np.interp(np.squeeze(np.argwhere(np.isnan(x))), np.squeeze(np.argwhere(~np.isnan(x))), x[~np.isnan(x)])
get_spectro(x, fs, ax3, 'interpolated data')
plt.subplots_adjust(hspace=0.8)
plt.show()页面原文内容由Stack Overflow提供。腾讯云小微IT领域专用引擎提供翻译支持
原文链接:
https://stackoverflow.com/questions/65624830
复制相关文章
相似问题
腾讯云开发者

Copyright © 2013 - 2026 Tencent Cloud. All Rights Reserved. 腾讯云 版权所有
深圳市腾讯计算机系统有限公司 ICP备案/许可证号:粤B2-20090059 ![]() 粤公网安备44030502008569号
粤公网安备44030502008569号
腾讯云计算(北京)有限责任公司 京ICP证150476号 | 京ICP备11018762号