
CatBoostRegressor树中叶子值的比例是多少?
拼图
我无法解释CatBoostRegressor树叶子中的值。拟合模型正确地捕捉了数据集的逻辑,但是当我绘制一棵树时,值的比例与实际数据集的规模不匹配。
在这个例子中,我们预测size,它的值在15-30左右,这取决于观测的color和age。
import random
import pandas as pd
import numpy as np
from catboost import Pool, CatBoostRegressor

# Create a fake dataset.
n = 1000
random.seed(1)
df = pd.DataFrame([[random.choice(['red', 'blue', 'green', 'yellow']),
                    random.random() * 100]
                   for i in range(n)],
                  columns=['color', 'age'])
df['size'] = np.select([np.logical_and(np.logical_or(df.color == 'red',
                                                     df.color == 'blue'),
                                       df.age < 50),
                        np.logical_or(df.color == 'red',
                                      df.color == 'blue'),
                        df.age < 50,
                        True],
                       [np.random.normal(loc=15, size=n),
                        np.random.normal(loc=20, size=n),
                        np.random.normal(loc=25, size=n),
                        np.random.normal(loc=30, size=n)])

# Fit a CatBoost regressor to the dataset.
pool = Pool(df[['color', 'age']], df['size'],
            feature_names=['color', 'age'], cat_features=[0])
m = CatBoostRegressor(n_estimators=10, max_depth=3, one_hot_max_size=4,
                      random_seed=1)
m.fit(pool)

# Visualize the first regression tree (saves to a pdf).  Values in leaf nodes
# are not on the scale of the original dataset.
m.plot_tree(tree_idx=0, pool=pool).render('regression_tree')
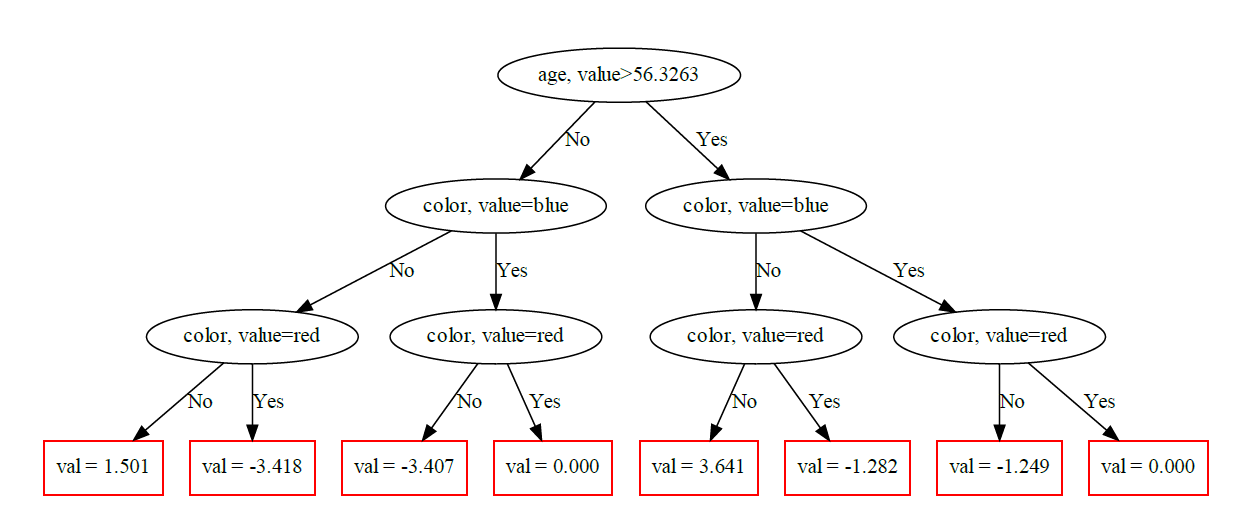
该模型在age上以正确的值(约50)分裂,并正确地了解到红色和蓝色观测与绿色和黄色观测不同。叶中的值排序正确(例如,50以下的红/蓝观测值最小),但尺度完全不同。
predict()函数返回原始数据集规模上的值。
>>> df['predicted'] = m.predict(df)
>>> df.sample(n=10)
      color        age       size  predicted
676  yellow  66.305095  30.113389  30.065519
918  yellow  55.209821  29.944622  29.464825
705  yellow   1.742565  24.209283  24.913988
268    blue  76.749979  20.513211  20.019020
416    blue  59.807800  18.807197  19.949336
326     red   4.621795  14.748898  14.937314
609  yellow  99.165027  28.942243  29.823422
421   green  40.731038  26.078450  24.846742
363  yellow   2.461971  25.506517  24.913988
664     red   5.206448  16.579706  14.937314
我试过的
我想知道是否存在某种简单的正常化,但情况显然并非如此。例如,一个年龄< 50岁的红色观测值在树中被赋值为-3.418,这个值与实际值的z得分(大约15)很不接近。
>>> (15 - np.mean(df['size'])) / np.std(df['size'])
-1.3476124913754326这个职位问了一个类似的关于XGBoost的问题。接受的答案解释了所有的值都应该添加到base_score参数中;但是,如果CatBoost中有一个类似的参数,我就找不到它。(如果参数在CatBoost中有不同的名称,我不知道它的名称是什么。)此外,CatBoost树中的值不仅与原始数据集存在一定的常量差异,最大和最小叶节点之间的差值约为7,而原始数据集中size的最大值和最小值之间的差值约为15。
我查看了CatBoost文档,但没有成功。"模型值“部分说回归值是”应用模型产生的一个数字“,这意味着它们应该在原始数据集的规模上。(对于predict()的输出来说,这是事实,所以我不清楚本节是否适用于绘制的决策树。)
回答 1
Stack Overflow用户
发布于 2022-03-31 18:54:33
搜索此函数,get_scale_and_bias返回模型的比例和偏差。
这些值影响应用模型的结果,因为模型的预测结果计算如下:\sum leaf_values \cdot比例尺+ bias∑leaf_values⋅scale+bias
应用于问题中的示例
下面是一个与相同数据集相适应的略有不同的模型(使用与上面相同的代码)。
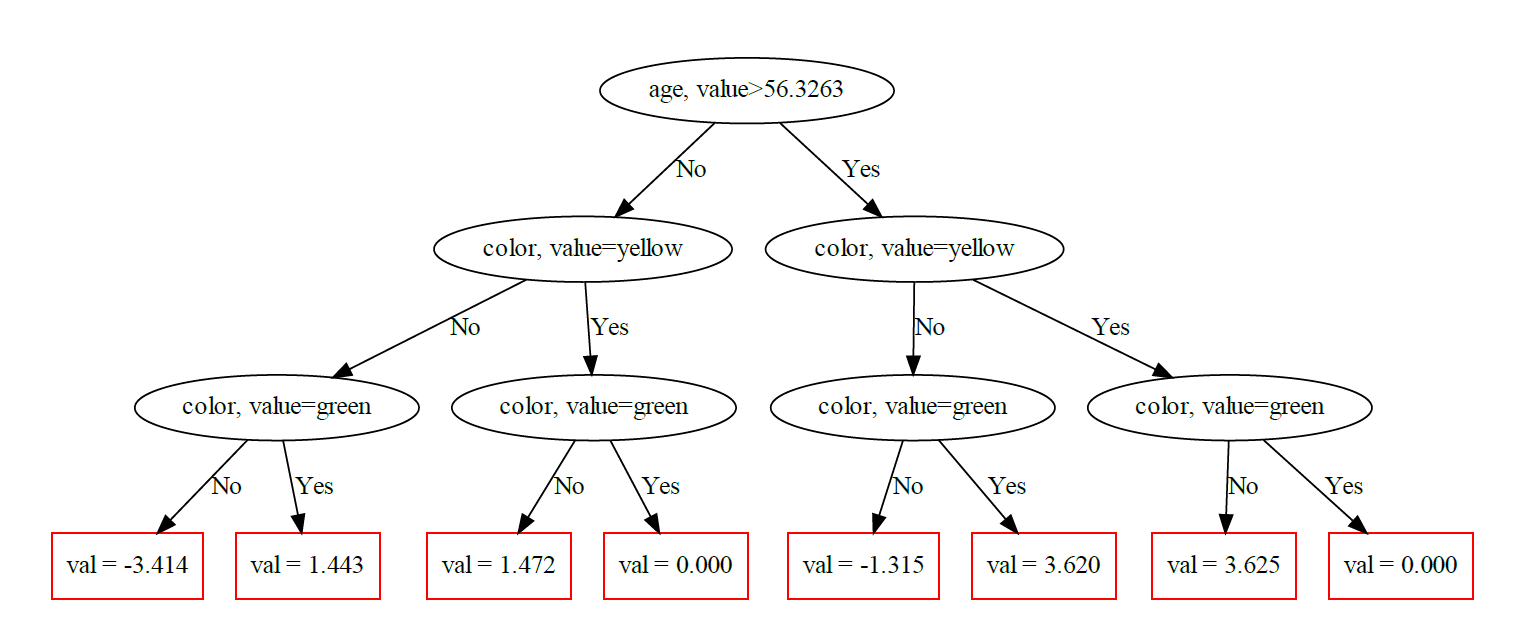
若要将叶值转换为原始数据刻度,请使用get_scale_and_bias()返回的刻度和偏差。我使用_get_tree_leaf_values()提取叶子;这个函数返回叶的字符串表示,因此我们必须执行一些正则表达式解析才能得到实际值。根据上面的数据生成过程,我还手工编码了每一片叶子的期望值.
# Get the scale and bias from the model.
sb = m.get_scale_and_bias()

# Apply the scale and bias to the leaves of the tree; compare to expected
# values for each leaf.
import re
[{'expected': [15, 25, 25, None, 20, 30, 30, None][i],
  'actual': (float(re.sub(r'^val = (-?[0-9]+([.][0-9]+)?).*$', '\\1', leaf))
             * sb[0]) + sb[1]}
 for i, leaf in enumerate(m._get_tree_leaf_values(0))]
我们看到,预测值并不完美,但至少在正确的范围内。
[{'expected': 15, 'actual': 19.210155044555663},
 {'expected': 25, 'actual': 24.067155044555665},
 {'expected': 25, 'actual': 24.096155044555665},
 {'expected': None, 'actual': 22.624155044555664},
 {'expected': 20, 'actual': 21.309155044555663},
 {'expected': 30, 'actual': 26.244155044555665},
 {'expected': 30, 'actual': 26.249155044555664},
{'expected': None, 'actual': 22.624155044555664}]https://stackoverflow.com/questions/69470096
复制相似问题
腾讯云开发者

Copyright © 2013 - 2026 Tencent Cloud. All Rights Reserved. 腾讯云 版权所有
深圳市腾讯计算机系统有限公司 ICP备案/许可证号:粤B2-20090059 ![]() 粤公网安备44030502008569号
粤公网安备44030502008569号
腾讯云计算(北京)有限责任公司 京ICP证150476号 | 京ICP备11018762号