
KeyError:' acc‘-> acc= history.history['acc']
KeyError:' acc‘-> acc= history.history['acc']
提问于 2022-10-10 15:05:25
代码链接:https://colab.research.google.com/drive/1_a4PLwDiFhF7qVlX_vvwKM4QM4Dxu0L0?usp=sharing
import matplotlib.pyplot as plt

acc = history.history['acc']
val_acc = history.history['val_accuracy']
loss = history.history['loss']
val_loss = history.history['val_loss']

epochs = range(1, len(acc) + 1)

# "bo" is for "blue dot"
plt.plot(epochs, loss, 'bo', label='Training loss')
# b is for "solid blue line"
plt.plot(epochs, val_loss, 'b', label='Validation loss')
plt.title('Training and validation loss')
plt.xlabel('Epochs')
plt.ylabel('Loss')
plt.legend()

plt.show()
错误显示:
KeyError                                  Traceback (most recent call last)

<ipython-input-31-12e4df2349dc> in <module>
      1 import matplotlib.pyplot as plt
      2
----> 3 acc = history.history['acc']
      4 val_acc = history.history['val_accuracy']
      5 loss = history.history['loss']

KeyError: 'acc'
嗨,我试过这个练习3.5-分类-电影-评论.I从深入学习与python -manning和显示错误,请帮助?
回答 1
Stack Overflow用户
发布于 2022-10-10 15:40:57
示例:粗略地绘制图表,显示需要更多的时间--这仅仅是15个年代--使用MNST数据库中的几个简单的密集层。
历史是您作为数组添加的字典或它作为日志结果创建的训练,请在条件之前使用model.fit()或回调方法。
import os
from os.path import exists
import tensorflow as tf
import tensorflow_datasets as tfds
import matplotlib.pyplot as plt
"""""""""""""""""""""""""""""""""""""""""""""""""""""""""
Variables
"""""""""""""""""""""""""""""""""""""""""""""""""""""""""
RANDOM_STATE = 21
BATCH_SIZE = 16
EPOCHES = 15
"""""""""""""""""""""""""""""""""""""""""""""""""""""""""
DataSet
"""""""""""""""""""""""""""""""""""""""""""""""""""""""""
ds = tfds.load('mnist', split='train', shuffle_files=True)
ds = ds.shuffle(1024).batch(64).prefetch(tf.data.experimental.AUTOTUNE)
assert isinstance(ds, tf.data.Dataset)
for example in ds.take(1):
image, label = example["image"], example["label"]
list_image = [ ]
list_label = [ ]
list_image = tf.constant(image, shape=(64, 28, 28)).numpy()
list_label = tf.constant(label, shape=(64, 1, 1)).numpy()
samples=image.shape[0]
y_train = tf.random.uniform((samples, 1, 1), maxval=2, dtype=tf.int32)
model = tf.keras.models.Sequential([ ])
model.add(tf.keras.layers.Dense(64, activation='relu', input_shape=(28, 28, 1)))
model.add(tf.keras.layers.Dropout(0.18))
model.add(tf.keras.layers.Dense(32, activation='relu'))
model.add(tf.keras.layers.Dropout(0.15))
model.add(tf.keras.layers.Dense(1, activation='sigmoid'))
es = tf.keras.callbacks.EarlyStopping(monitor='val_loss', patience=5)
# Compiling the model
model.compile(loss='bce', optimizer='adam', metrics=['binary_accuracy'])
# Fitting the model
history = model.fit(list_image, y_train, batch_size = BATCH_SIZE, validation_data =(list_image, y_train), epochs = EPOCHES, callbacks=[es]) # verbose = 0
# Check out our train loss and test loss over epochs.
train_loss = history.history['loss']
test_loss = history.history['val_loss']
y_train = tf.constant(y_train, shape=(64, )).numpy()
print( test_loss )
print( y_train )
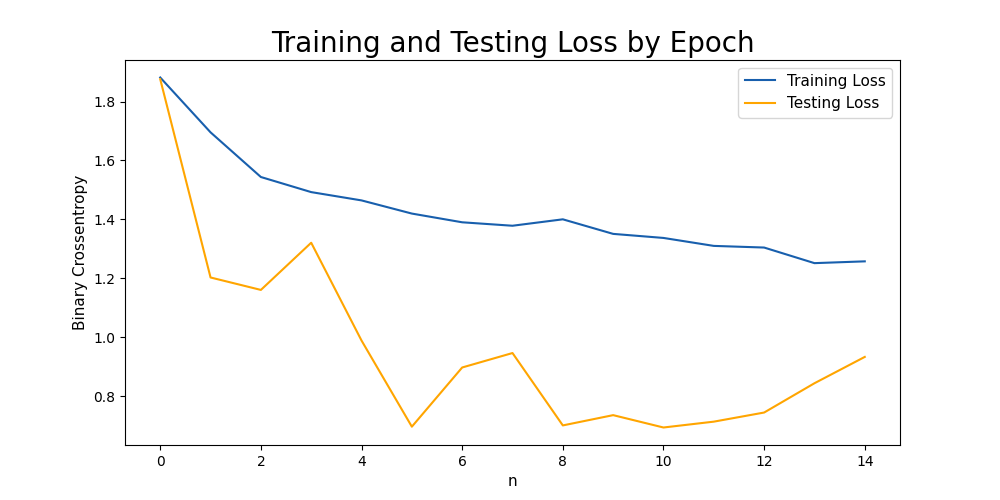
# Visualizing our training and testing loss by epoch
plt.figure(figsize=(10, 5))
plt.plot(train_loss, label='Training Loss', color='#185fad')
plt.plot(test_loss, label='Testing Loss', color='orange')
# plt.plot(y_train, label='y_train', color='blue')
plt.title('Training and Testing Loss by Epoch', fontsize = 20)
# plt.title('label input', fontsize = 20)
plt.xlabel('Epoch', fontsize = 11)
plt.xlabel('n', fontsize = 11)
plt.ylabel('Binary Crossentropy', fontsize = 11)
plt.legend(fontsize = 11)
plt.show()
input('...')输出:
页面原文内容由Stack Overflow提供。腾讯云小微IT领域专用引擎提供翻译支持
原文链接:
https://stackoverflow.com/questions/74016944
复制相关文章
相似问题
腾讯云开发者

Copyright © 2013 - 2026 Tencent Cloud. All Rights Reserved. 腾讯云 版权所有
深圳市腾讯计算机系统有限公司 ICP备案/许可证号:粤B2-20090059 ![]() 粤公网安备44030502008569号
粤公网安备44030502008569号
腾讯云计算(北京)有限责任公司 京ICP证150476号 | 京ICP备11018762号