
在R中,我如何用程序包分集来绘制右删失数据的威布尔概率密度函数?
在R中,我如何用程序包分集来绘制右删失数据的威布尔概率密度函数?
提问于 2022-08-07 21:19:45
我试图覆盖一个威布尔概率密度函数(PDF)的右删失数据的直方图上的数据使用包fitdistrplus,但一直无法这样做。
df是一个包含虚拟数据集的data.frame,其格式为我的更大的数据集。
> library(fitdistrplus)
> left     <- c(rep(1,12),rep(2,5),rep(3,3),rep(4,2),rep(5,1))
> right    <- c(rep(1,12),rep(2,5),rep(3,3),rep(4,2),NA)
> (df      <- data.frame(left,right))
   left right
1     1     1
2     1     1
3     1     1
4     1     1
5     1     1
6     1     1
7     1     1
8     1     1
9     1     1
10    1     1
11    1     1
12    1     1
13    2     2
14    2     2
15    2     2
16    2     2
17    2     2
18    3     3
19    3     3
20    3     3
21    4     4
22    4     4
23    5    NA
> fitcen   <- fitdistrplus::fitdistcens(df,"weibull")
> fitdistrplus::plotdistcens(df,
+                            distr = "weibull",
+                            para = list(fitcen$estimate[1],fitcen$estimate[2]))
执行上面的脚本将生成下面的数字。

我已经成功地覆盖了一个威布尔PDF的直方图,一个非审查版本的这个虚拟数据集(以下)。下图中的左上角图非常接近我的目标,只不过它显示的是非删失数据的PDF,而不是右删失数据。
> noncens <- fitdistrplus::fitdist(left, distr = "weibull")
> plot(noncens)

回答 1
Stack Overflow用户
发布于 2022-08-07 22:34:52
编辑:当我读到更多,我看到这可能是一个多步骤的过程,比一个单一的答案更复杂。
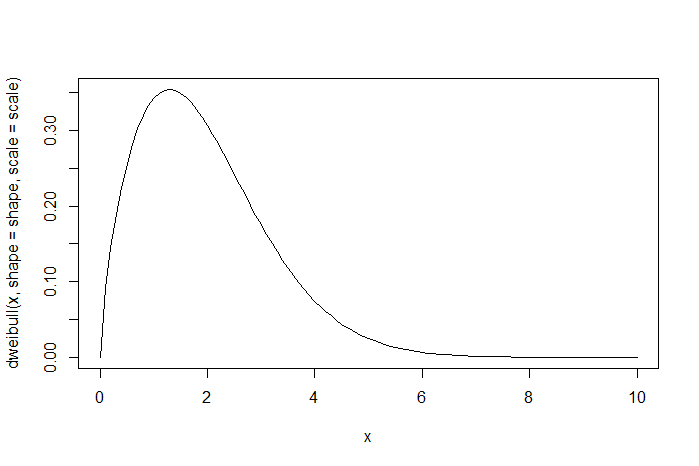
部分答案:从fitcen中提取斜率和比例尺值,并使用函数dweibull()生成PDF的绘图。此处不包括值的直方图。
> shape <- fitcen$estimate[1]
> scale <- fitcen$estimate[2]
> curve(dweibull(x, shape=shape, scale=scale), from=0, to=10)
页面原文内容由Stack Overflow提供。腾讯云小微IT领域专用引擎提供翻译支持
原文链接:
https://stackoverflow.com/questions/73271140
复制相关文章
相似问题
腾讯云开发者

Copyright © 2013 - 2026 Tencent Cloud. All Rights Reserved. 腾讯云 版权所有
深圳市腾讯计算机系统有限公司 ICP备案/许可证号:粤B2-20090059 ![]() 粤公网安备44030502008569号
粤公网安备44030502008569号
腾讯云计算(北京)有限责任公司 京ICP证150476号 | 京ICP备11018762号