
定义正确的scipy.signal.spectrogram输入参数
定义正确的scipy.signal.spectrogram输入参数
提问于 2022-05-05 22:14:09
我有以下代码:
sampling_rate=128
N = sampling_rate
_f, t, Sxx = signal.spectrogram(_signal, sampling_rate, nperseg=N, nfft=N, noverlap=N-1, mode="complex")
cm = plt.pcolormesh(t, _f, np.log(np.abs(Sxx)), cmap="viridis")
plt.savefig('Spectogram.png', dpi=300, frameon='false')
这给了我以下的情节:
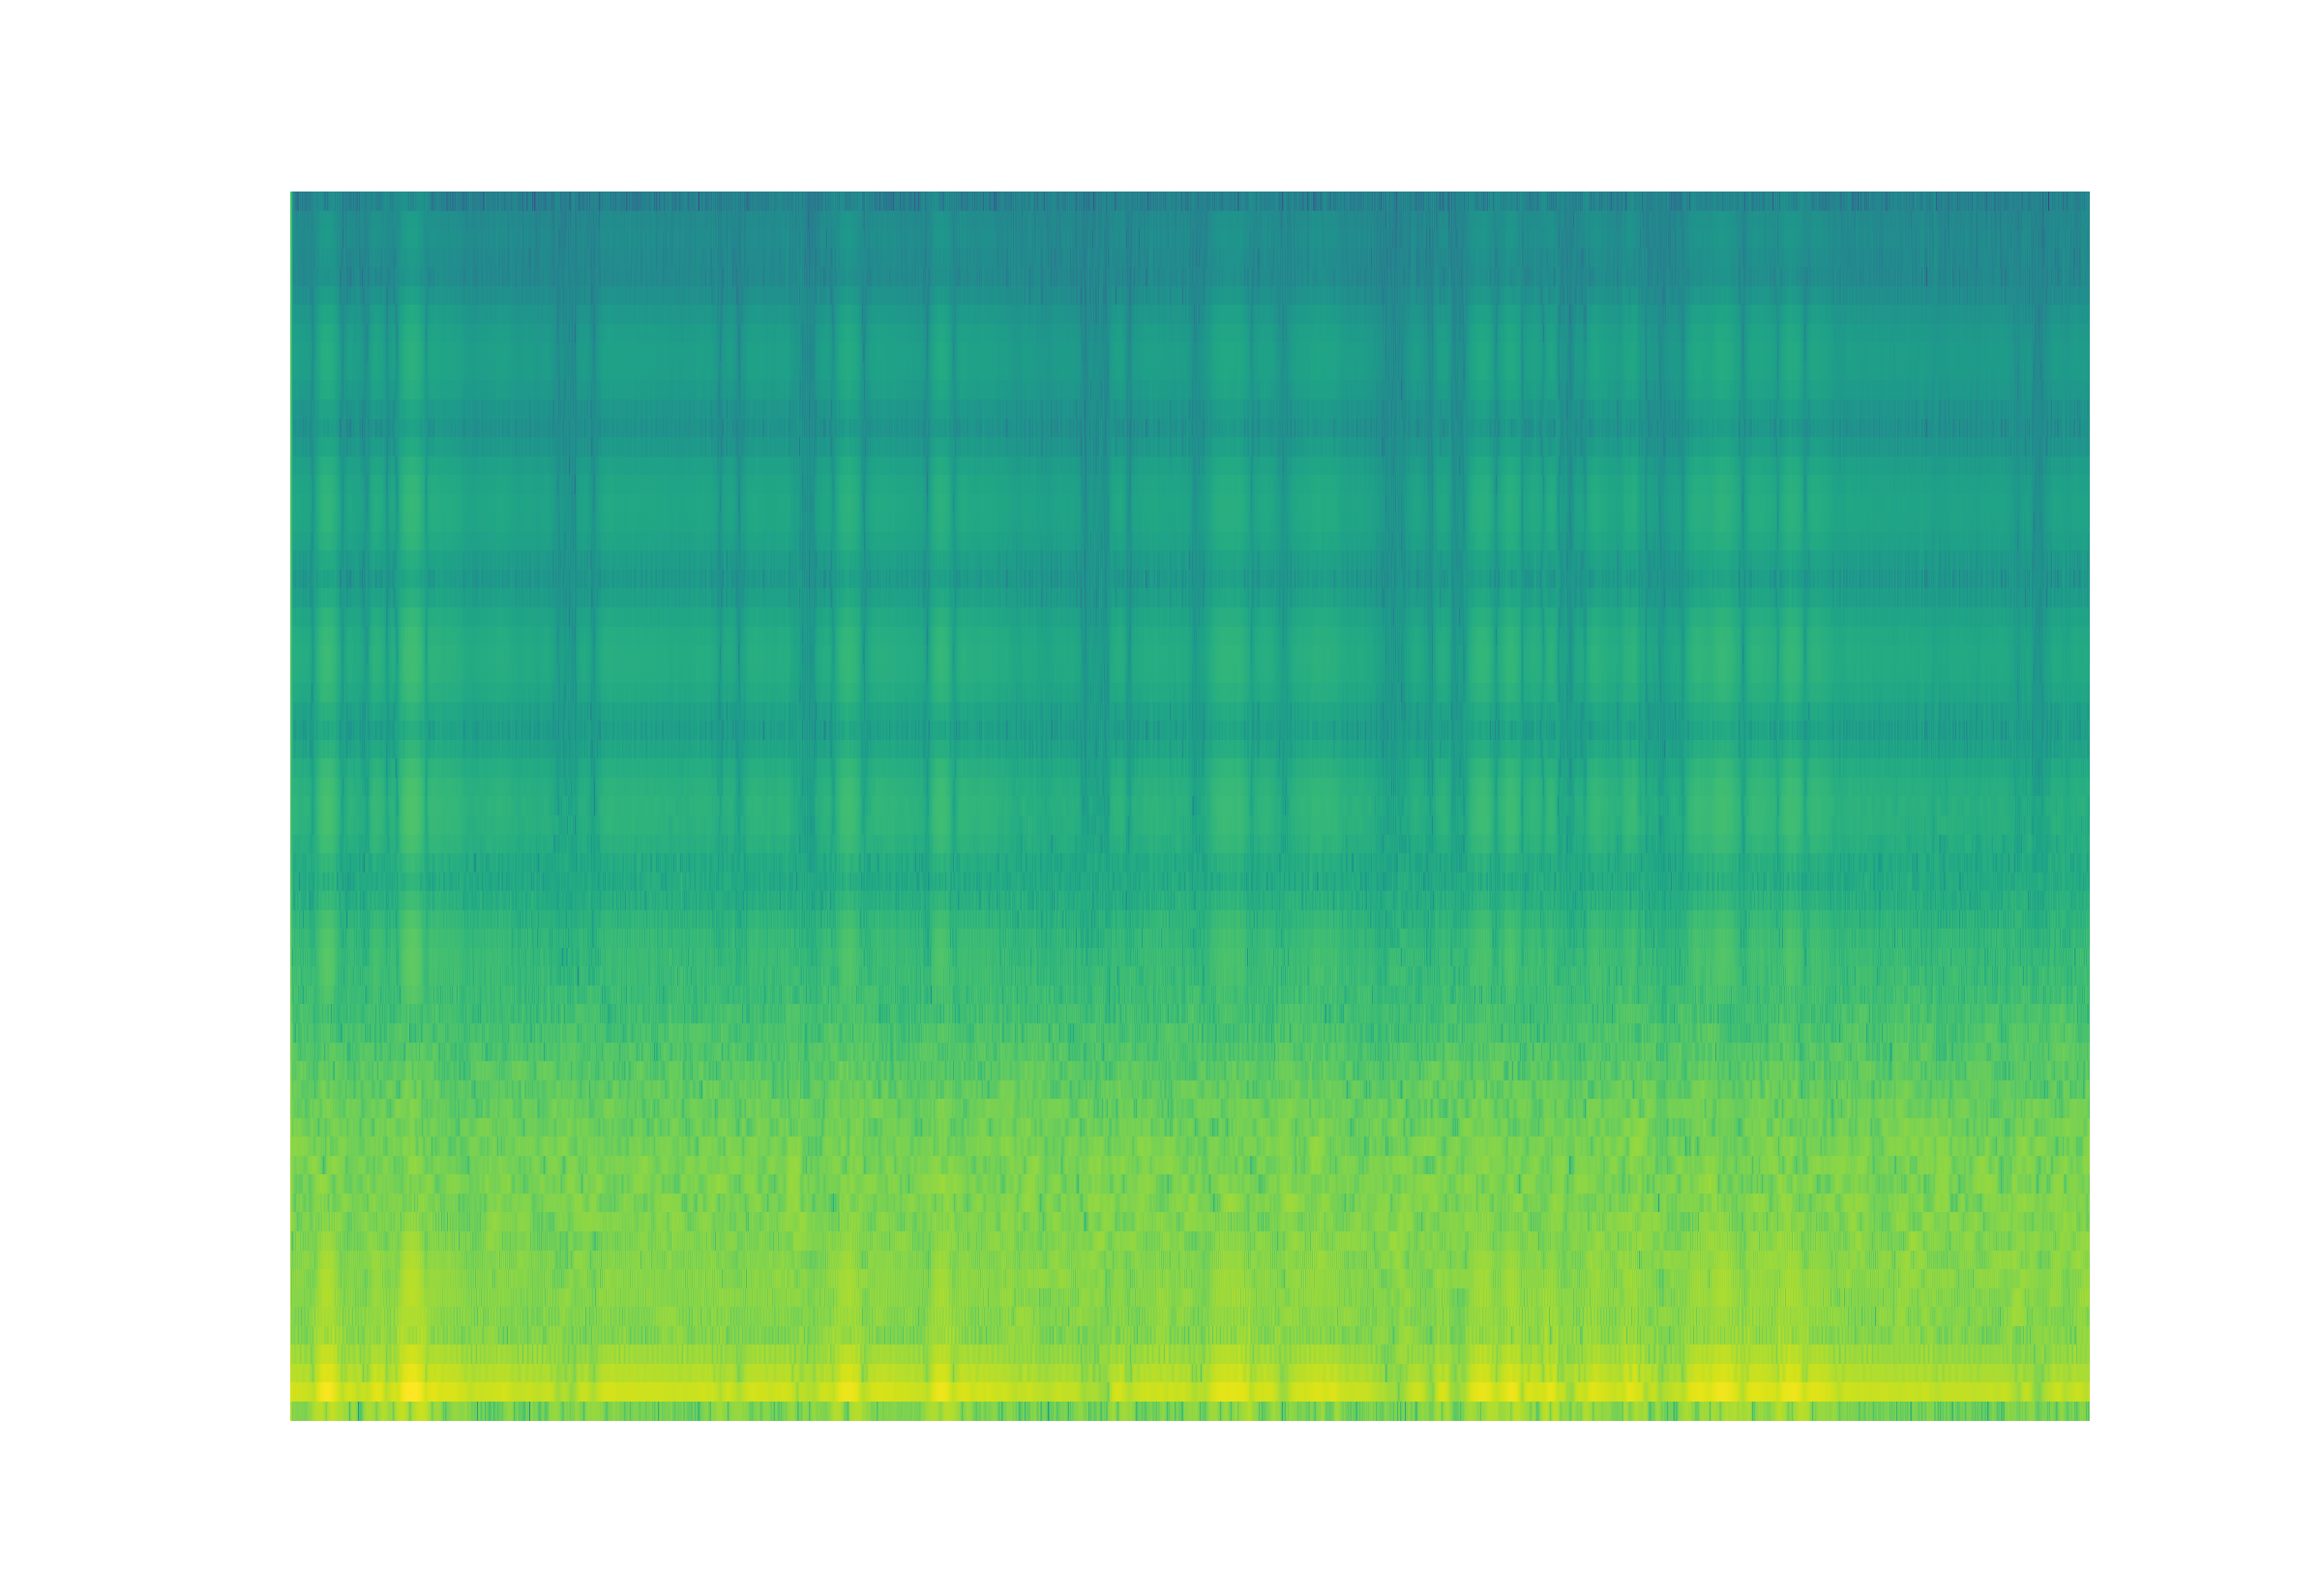
定义正确参数的正确方法是什么,即: nperseg、nfft和noverlap以获得正确和平滑的绘图?
谢谢!
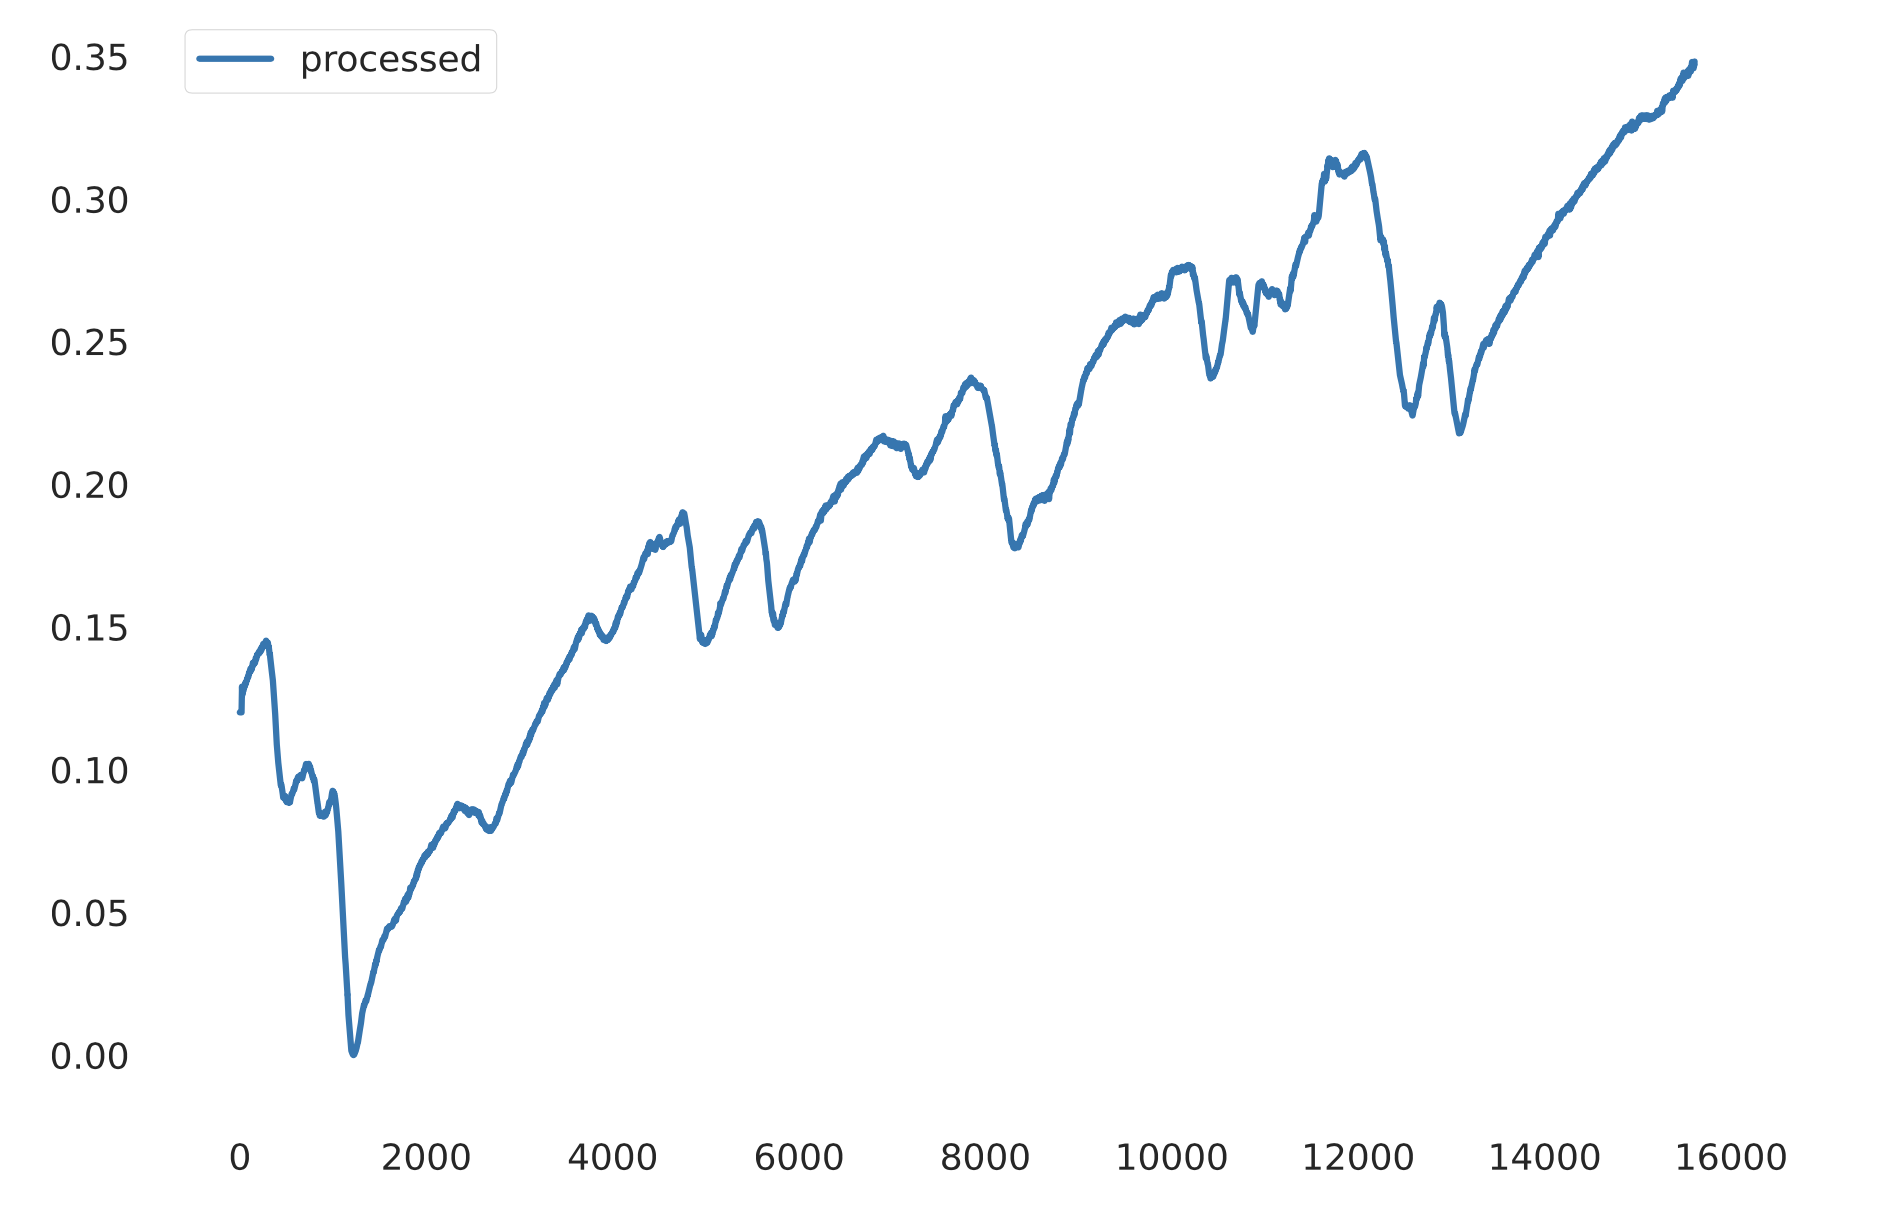
输入信号的图:
回答 1
Stack Overflow用户
回答已采纳
发布于 2022-05-09 15:25:18
我能够通过标准化输入信号来解决这个问题,并做:
t, f, Sxx = signal.spectrogram(filt_signal[sampleIDX], fs=128,
                        nperseg=200, noverlap=180, return_onesided=True)
Sxx = np.log(Sxx)
Sxx = (Sxx - np.min(Sxx)) / (np.max(Sxx) - np.min(Sxx))
image_Sxx = Image.fromarray(np.uint8(cm.viridis(Sxx)*255))页面原文内容由Stack Overflow提供。腾讯云小微IT领域专用引擎提供翻译支持
原文链接:
https://stackoverflow.com/questions/72134163
复制相关文章
相似问题
腾讯云开发者

Copyright © 2013 - 2026 Tencent Cloud. All Rights Reserved. 腾讯云 版权所有
深圳市腾讯计算机系统有限公司 ICP备案/许可证号:粤B2-20090059 ![]() 粤公网安备44030502008569号
粤公网安备44030502008569号
腾讯云计算(北京)有限责任公司 京ICP证150476号 | 京ICP备11018762号