
未能按组绘制R package Divnet生成的phyloseq对象
未能按组绘制R package Divnet生成的phyloseq对象
提问于 2022-03-14 04:05:34
我打算绘制我的样本的阿尔法多样性图,其中包括三个组。阿尔法分集由R包Divnet计算。它涉及使用phyloseq作为依赖项。
每个样本的组在sam_data中指定,系统对象"df_family“中的列"type”是由多样性估计和标准误差组成的列表。
下面是我使用的代码:
dv$shannon %>% plot(df_family, color = "type", group = df_family@sam_data$type) +
xlab("sample type") +
ylab("Shannon diversity estimate (family level)") +
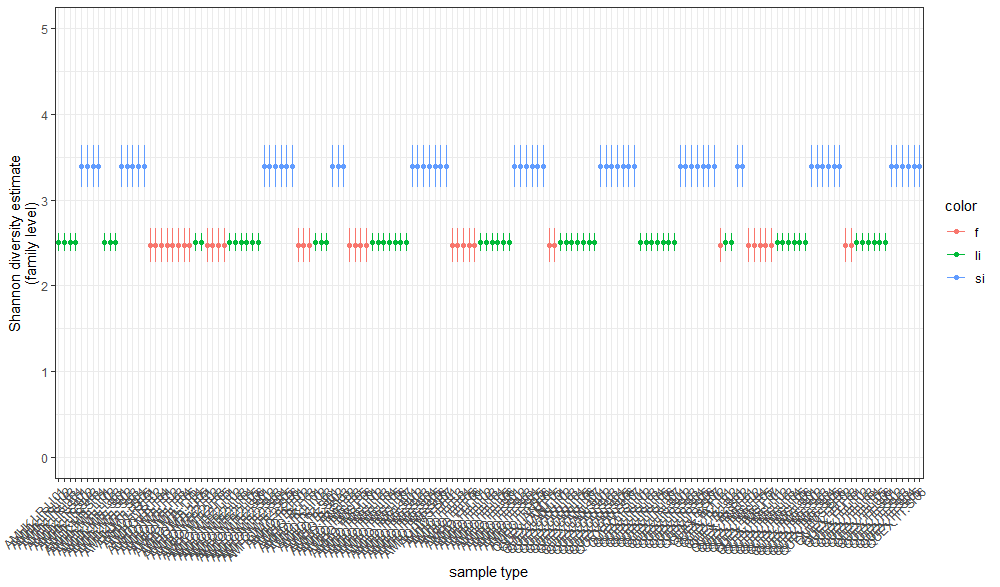
coord_cartesian(ylim = c(0,5))`我得到的是:
这些样本是独立显示的,而不是聚在一起的。
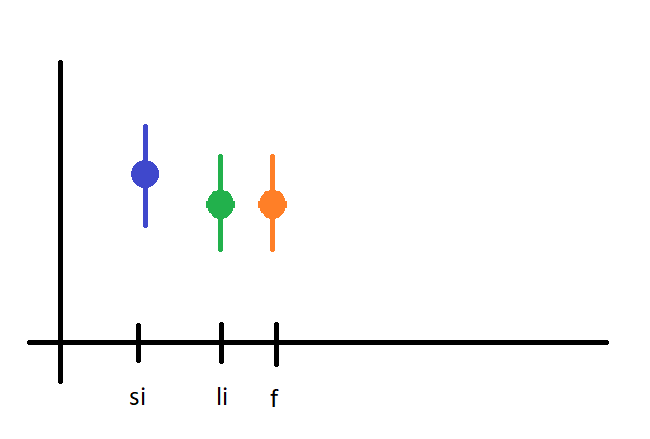
以下是我想要得到的:
回答 1
Stack Overflow用户
发布于 2022-03-14 08:24:36
一旦您已经拥有了phyloseq对象df_family,就可以使用来自phyloseq的函数estimate_richness。然后,您可以将示例元数据加入到这个alpha多样性的数据框架中。最后,您可以直接使用ggplot2来定制相应的绘图,例如在x轴放置不同的示例组(此处为SampleType):
library(tidyverse)
library(phyloseq)

# get example phy object
otufile <- system.file("extdata", "GP_otu_table_rand_short.txt.gz", package = "phyloseq")
mapfile <- system.file("extdata", "master_map.txt", package = "phyloseq")
df_family <- import_qiime(otufile, mapfile, trefile, showProgress = FALSE)

alphadiv <-
  df_family %>%
  estimate_richness() %>%
  as_tibble(rownames = "sample_id") %>%
  left_join(df_family@sam_data %>% as_tibble(rownames = "sample_id"))
alphadiv

alphadiv %>%
  ggplot(aes(x = SampleType, y = Shannon)) +
  geom_boxplot()
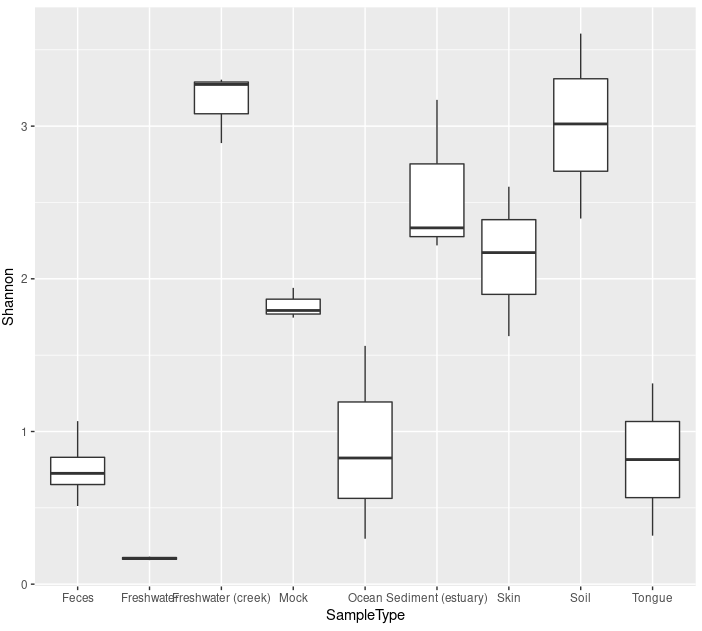
您还可以在aes中添加其他示例属性,例如,如果aes(x = SampleType, y = Shannon, color = my_group)是一个包含f、li或si单元格的示例属性列。
页面原文内容由Stack Overflow提供。腾讯云小微IT领域专用引擎提供翻译支持
原文链接:
https://stackoverflow.com/questions/71462893
复制相关文章
相似问题
腾讯云开发者

Copyright © 2013 - 2026 Tencent Cloud. All Rights Reserved. 腾讯云 版权所有
深圳市腾讯计算机系统有限公司 ICP备案/许可证号:粤B2-20090059 ![]() 粤公网安备44030502008569号
粤公网安备44030502008569号
腾讯云计算(北京)有限责任公司 京ICP证150476号 | 京ICP备11018762号