
可以在松脚本中调用“回归趋势”工具吗?
可以在松脚本中调用“回归趋势”工具吗?
提问于 2022-03-05 14:55:24
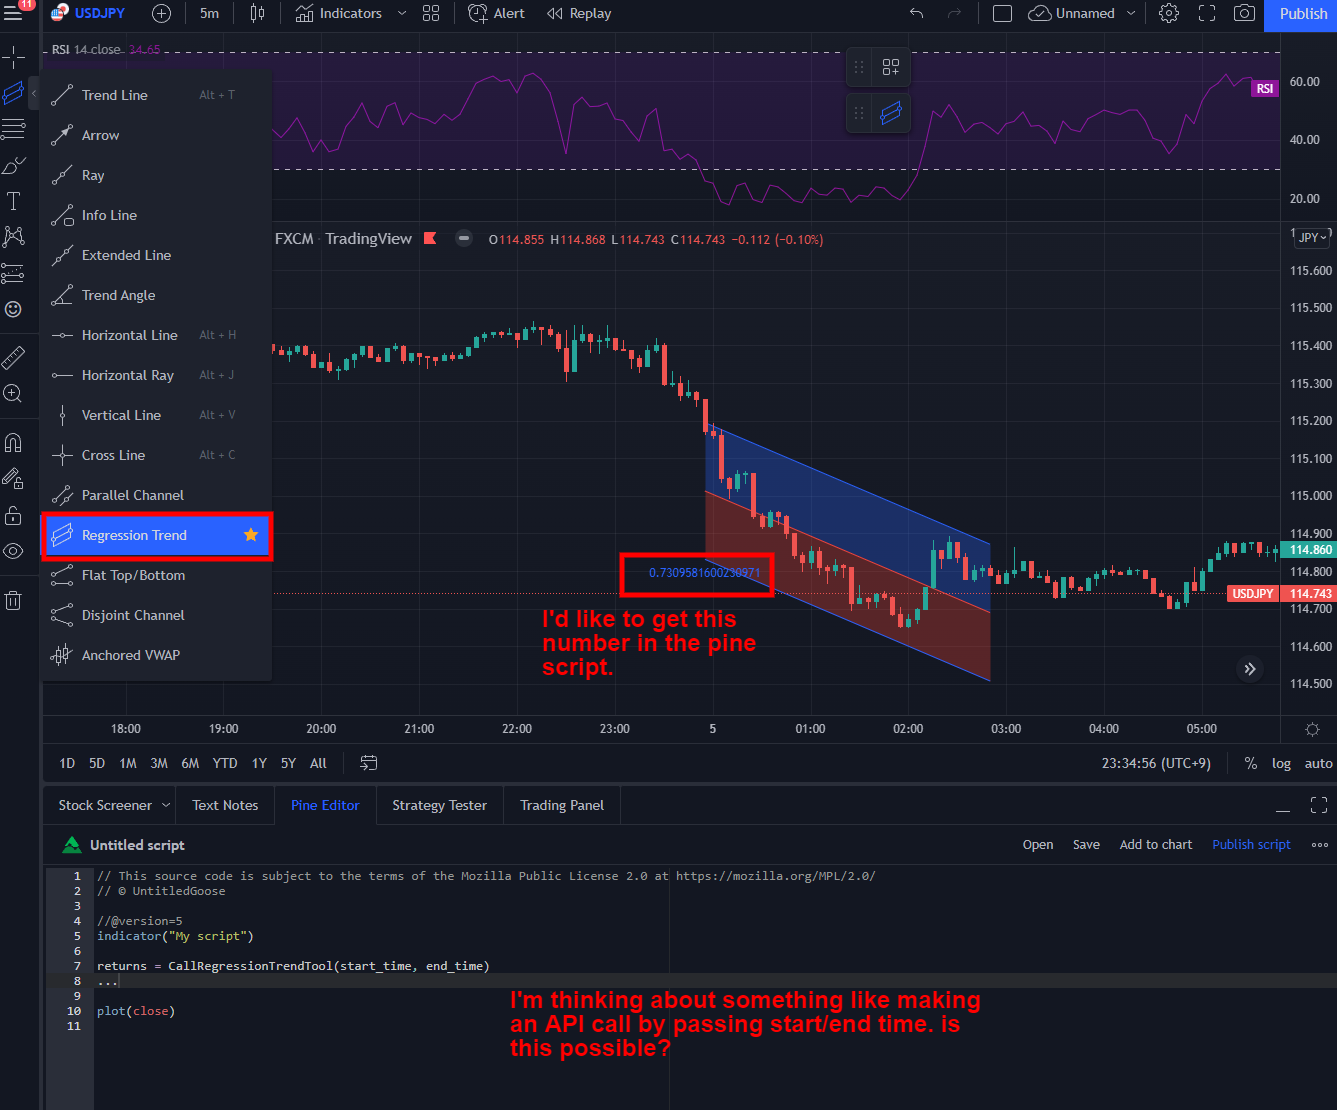
TradingView在其UI中有这种方便的回归趋势工具,可以在指定的时间内生成趋势通道。
我试图创建一个松树脚本使用这个回归趋势和自动生成趋势通道在过去一个月,3个月,6个月,然后分析他们的趋势强度。
但是,我已经检查了他们的松脚本手册n,似乎没有一个API可以用松脚本调用这个工具。
我的问题是,
- 是否可以使用松本脚本将此称为“回归趋势”工具?
- 如果不可能,是否有办法产生趋势渠道和计算趋势强度松树脚本?
请看下面的图片,看看我想要完成的事情。
回答 1
Stack Overflow用户
发布于 2022-04-29 21:11:52
回答我自己的问题。下面的脚本创建与回归工具相同的趋势线。请注意,该脚本工作在松树脚本v5 env。
// This source code is subject to the terms of the Mozilla Public License 2.0 at https://mozilla.org/MPL/2.0/
// © legend507

//@version=5
indicator("Linear regression trend lines", overlay=true)

// Config group 1 - Controls # of days to use for trendline calc and which data to use (open or close).
group1 = "LINEAR REGRESSION SETTING"
lengthInput = input.int(30, title="Length", minval = 1, maxval = 5000, group=group1)  // By default use 30 bars. Use 1 bar = 1 day then it's roughly 1 month ago.
sourceInput = input.source(close, title="Source", group=group1)

// Config groups 2 - Controls if a line is visible.
group2 = "LINEAR REGRESSION SWITCH"
useDev1Input = input.bool(true, title="Large LinReg On / Off", group=group2)
useDev2Input = input.bool(true, title="Medium LinReg On / Off", group=group2)
useDev3Input = input.bool(true, title="Small LinReg On / Off", group=group2)

useUpperDevInput = true
upperMultInput = 3.0
useLowerDevInput = true
lowerMultInput = 3.0
useUpperDevInput2 = true
upperMultInput2 = 2.0
useLowerDevInput2 = true
lowerMultInput2 = 2.0
useUpperDevInput3 = true
upperMultInput3 = 1.0
useLowerDevInput3 = true
lowerMultInput3 = 1.0

// Config group 3 - Controls if lines are extended longer on the left / right.
group3 = "LINEAR REGRESSION EXTEND LINES"
extendLeftInput = input.bool(false, "Extend Lines Left", group=group3)
extendRightInput = input.bool(true, "Extend Lines Right", group=group3)
extendStyle = switch
    extendLeftInput and extendRightInput => extend.both
    extendLeftInput => extend.left
    extendRightInput => extend.right
    => extend.none

// Config group 4 - Controls line width.
group4 = "LINEAR REGRESSION WIDTH"
a_lwidth = input.int(2, title='Large LinReg Width', minval=0, maxval=10, group=group4)
b_lwidth = input.int(1, title='Medium LinReg Width', minval=0, maxval=10, group=group4)
c_lwidth = input.int(1, title='Small LinReg Width', minval=0, maxval=10, group=group4)
d_lwidth = input.int(2, title='Base Line LinReg Width', minval=0, maxval=10, group=group4)

// Config group 5 - Controls line solid, dotted, dashed, etc.
group5 = "LINEAR REGRESSION STYLE"
A_LineStyle_Type = input.string(title='Large LinReg Type', defval='Dotted', options=['Dashed', 'Dotted', 'Solid'], group=group5)
A_Line_Type = A_LineStyle_Type == 'Dashed' ? line.style_dashed : A_LineStyle_Type == 'Dotted' ? line.style_dotted : line.style_solid
B_LineStyle_Type = input.string(title='Medium LinReg Type', defval='Solid', options=['Dashed', 'Dotted', 'Solid'], group=group5)
B_Line_Type = B_LineStyle_Type == 'Dashed' ? line.style_dashed : B_LineStyle_Type == 'Dotted' ? line.style_dotted : line.style_solid
C_LineStyle_Type = input.string(title='Small LinReg Type', defval='Dashed', options=['Dashed', 'Dotted', 'Solid'], group=group5)
C_Line_Type = C_LineStyle_Type == 'Dashed' ? line.style_dashed : C_LineStyle_Type == 'Dotted' ? line.style_dotted : line.style_solid
D_LineStyle_Type = input.string(title='Base Line LinReg Type', defval='Solid', options=['Dashed', 'Dotted', 'Solid'], group=group5)
D_Line_Type = D_LineStyle_Type == 'Dashed' ? line.style_dashed : D_LineStyle_Type == 'Dotted' ? line.style_dotted : line.style_solid

// Config group 6 - Controls line colors.
group6 = "LINEAR REGRESSION COLOR"
colorLarge = input.color(color.new(#ffffff, 0), "Large Linreg", inline=group6, group=group6)  // Outer line color default: white
colorMedium = input.color(color.new(#ff0000, 0), "Medium Linreg", inline=group6, group=group6)  // Middle line color defaul: red
colorSmall = input.color(color.new(#ffa500, 0), "Small Linreg", inline=group6, group=group6)  // Narror line color default: orange
colorBase = input.color(color.new(#0c3299, 0), "Base Line", inline=group6, group=group6)  // Baseline color default: blue

// Calculate slope based on input parameter & # of bars to use.
// (This slope calculation is genius.)
calcSlope(source, length) =>
    max_bars_back(source, 5000)
    // Check if current bar is last or we are only using 1 bar to calculate slope.
    if not barstate.islast or length <= 1
        [float(na), float(na), float(na)]
    else
        sumX = 0.0
        sumY = 0.0
        sumXSqr = 0.0
        sumXY = 0.0
        for i = 0 to length - 1 by 1
            val = source[i]
            per = i + 1.0
            sumX += per  // Sum of 1, 2, 3, ... until length
            sumY += val  // Sum of price value (default: close)
            sumXSqr += per * per
            sumXY += val * per
        slope = (length * sumXY - sumX * sumY) / (length * sumXSqr - sumX * sumX)
        average = sumY / length
        intercept = average - slope * sumX / length + slope
        [slope, average, intercept]

// Slope, average, intercept.
[s, a, i] = calcSlope(sourceInput, lengthInput)

// Calculate standard deviation.
calcDev(source, length, slope, average, intercept) =>
    upDev = 0.0
    dnDev = 0.0
    stdDevAcc = 0.0
    dsxx = 0.0
    dsyy = 0.0
    dsxy = 0.0
    periods = length - 1
    daY = intercept + slope * periods / 2
    val = intercept
    for j = 0 to periods by 1
        price = high[j] - val
        if price > upDev
            upDev := price
        price := val - low[j]
        if price > dnDev
            dnDev := price
        price := source[j]
        dxt = price - average
        dyt = val - daY
        price -= val
        stdDevAcc += price * price
        dsxx += dxt * dxt
        dsyy += dyt * dyt
        dsxy += dxt * dyt
        val += slope
    stdDev = math.sqrt(stdDevAcc / (periods == 0 ? 1 : periods))
    pearsonR = dsxx == 0 or dsyy == 0 ? 0 : dsxy / math.sqrt(dsxx * dsyy)
    [stdDev, pearsonR, upDev, dnDev]

[stdDev, pearsonR, upDev, dnDev] = calcDev(sourceInput, lengthInput, s, a, i)

// Draw trendlines based on returns of calcSlope and calcDev.
drawTrendlines(lengthInput, s, a, i, stdDev, pearsonR, upDev, dnDev) =>
    // linreg base function
    startPrice = i + s * (lengthInput - 1)
    endPrice = i
    var line baseLine = na
    if na(baseLine) and not na(startPrice)
        baseLine := line.new(bar_index - lengthInput + 1, startPrice, bar_index, endPrice, width=d_lwidth, style=D_Line_Type, extend=extendStyle, color=colorBase)
    else
        line.set_xy1(baseLine, bar_index - lengthInput + 1, startPrice)
        line.set_xy2(baseLine, bar_index, endPrice)
        na

    // large linreg function
    upperStartPrice = startPrice + (useUpperDevInput ? upperMultInput * stdDev : upDev)
    upperEndPrice = endPrice + (useUpperDevInput ? upperMultInput * stdDev : upDev)
    var line upper = na
    lowerStartPrice = startPrice + (useLowerDevInput ? -lowerMultInput * stdDev : -dnDev)
    lowerEndPrice = endPrice + (useLowerDevInput ? -lowerMultInput * stdDev : -dnDev)
    var line lower = na
    if na(upper) and not na(upperStartPrice)
        upper := useDev1Input ? line.new(bar_index - lengthInput + 1, upperStartPrice, bar_index, upperEndPrice, width=a_lwidth, style=A_Line_Type, extend=extendStyle, color=colorLarge) : na
    else
        line.set_xy1(upper, bar_index - lengthInput + 1, upperStartPrice)
        line.set_xy2(upper, bar_index, upperEndPrice)
        na
    if na(lower) and not na(lowerStartPrice)
        lower := useDev1Input ? line.new(bar_index - lengthInput + 1, lowerStartPrice, bar_index, lowerEndPrice, width=a_lwidth, style=A_Line_Type, extend=extendStyle, color=colorLarge) : na
    else
        line.set_xy1(lower, bar_index - lengthInput + 1, lowerStartPrice)
        line.set_xy2(lower, bar_index, lowerEndPrice)
        na

    // medium linreg function
    upperStartPrice2 = startPrice + (useUpperDevInput2 ? upperMultInput2 * stdDev : upDev)
    upperEndPrice2 = endPrice + (useUpperDevInput2 ? upperMultInput2 * stdDev : upDev)
    var line upper2 = na
    lowerStartPrice2 = startPrice + (useLowerDevInput2 ? -lowerMultInput2 * stdDev : -dnDev)
    lowerEndPrice2 = endPrice + (useLowerDevInput2 ? -lowerMultInput2 * stdDev : -dnDev)
    var line lower2 = na
    if na(upper2) and not na(upperStartPrice2)
        upper2 := useDev2Input ? line.new(bar_index - lengthInput + 1, upperStartPrice2, bar_index, upperEndPrice2, width=b_lwidth, style=B_Line_Type, extend=extendStyle, color=colorMedium) : na
    else
        line.set_xy1(upper2, bar_index - lengthInput + 1, upperStartPrice2)
        line.set_xy2(upper2, bar_index, upperEndPrice2)
        na
    if na(lower2) and not na(lowerStartPrice2)
        lower2 := useDev2Input ? line.new(bar_index - lengthInput + 1, lowerStartPrice2, bar_index, lowerEndPrice2, width=b_lwidth, style=B_Line_Type, extend=extendStyle, color=colorMedium) : na
    else
        line.set_xy1(lower2, bar_index - lengthInput + 1, lowerStartPrice2)
        line.set_xy2(lower2, bar_index, lowerEndPrice2)
        na

    // small linreg fuction
    upperStartPrice3 = startPrice + (useUpperDevInput3 ? upperMultInput3 * stdDev : upDev)
    upperEndPrice3 = endPrice + (useUpperDevInput3 ? upperMultInput3 * stdDev : upDev)
    var line upper3 = na
    lowerStartPrice3 = startPrice + (useLowerDevInput3 ? -lowerMultInput3 * stdDev : -dnDev)
    lowerEndPrice3 = endPrice + (useLowerDevInput3 ? -lowerMultInput3 * stdDev : -dnDev)
    var line lower3 = na
    if na(upper3) and not na(upperStartPrice3)
        upper3 := useDev3Input ? line.new(bar_index - lengthInput + 1, upperStartPrice3, bar_index, upperEndPrice3, width=c_lwidth, style=C_Line_Type, extend=extendStyle, color=colorSmall) : na
    else
        line.set_xy1(upper3, bar_index - lengthInput + 1, upperStartPrice3)
        line.set_xy2(upper3, bar_index, upperEndPrice3)
        na
    if na(lower3) and not na(lowerStartPrice3)
        lower3 := useDev3Input ? line.new(bar_index - lengthInput + 1, lowerStartPrice3, bar_index, lowerEndPrice3, width=c_lwidth, style=C_Line_Type, extend=extendStyle, color=colorSmall) : na
    else
        line.set_xy1(lower3, bar_index - lengthInput + 1, lowerStartPrice3)
        line.set_xy2(lower3, bar_index, lowerEndPrice3)
        na

    // Add tag to show slope to indicate strength of the trend.
    slopeLabel = label.new(bar_index - lengthInput + 1, upperStartPrice)
    label.set_text(slopeLabel, str.tostring(pearsonR))  // pearsonR is what is used in the official regression tool.

drawTrendlines(lengthInput, s, a, i, stdDev, pearsonR, upDev, dnDev)页面原文内容由Stack Overflow提供。腾讯云小微IT领域专用引擎提供翻译支持
原文链接:
https://stackoverflow.com/questions/71363232
复制相关文章
相似问题
腾讯云开发者

Copyright © 2013 - 2026 Tencent Cloud. All Rights Reserved. 腾讯云 版权所有
深圳市腾讯计算机系统有限公司 ICP备案/许可证号:粤B2-20090059 ![]() 粤公网安备44030502008569号
粤公网安备44030502008569号
腾讯云计算(北京)有限责任公司 京ICP证150476号 | 京ICP备11018762号