
曲线()在R中使用带参数的函数
曲线()在R中使用带参数的函数
提问于 2022-03-04 17:27:08
ppt=function(v, tail = 0.5){
  if (tail == 1){
    6/pi^2/v^2
  } else {
    if (v < 11) {
      (1-tail)*(11-v)/55
      } else {tail*6/pi^2/(v-10)^2}
  }
}
curve(ppt(tail = 0.2))
Error in curve(ppt(tail = 0.2)) :
  'expr' must be a function, or a call or an expression containing 'x'
我应该如何为函数ppt()绘制一条光滑的曲线,变量尾的值不同?
谢谢。
回答 2
Stack Overflow用户
回答已采纳
发布于 2022-03-04 17:32:05
也许是下一招?
w = 0.2
g <- function(z) ppt(z, tail = w)
curve(g)
别忘了替换,正如@MrFlick在评论中指出的那样:
if (v < 11) {
      (1-tail)*(11-v)/55
      } else {tail*6/pi^2/(v-10)^2}
通过
ifelse(v < 11, (1-tail)*(11-v)/55, tail*6/pi^2/(v-10)^2)Stack Overflow用户
发布于 2022-03-04 18:28:40
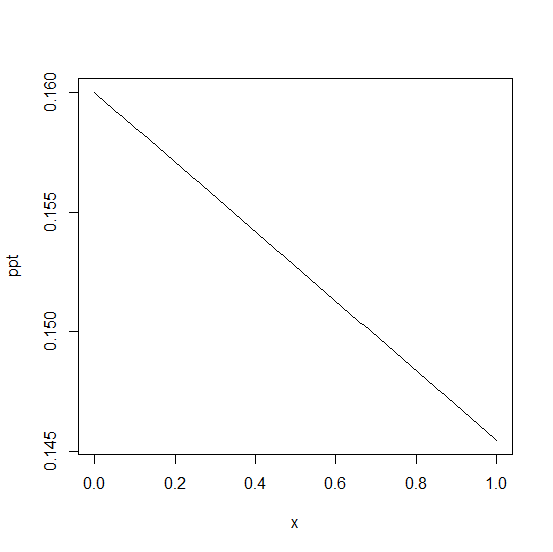
(1)重写ppt以将其矢量化(未显示)或其他(2)使用vectorize,如下所示,在这种情况下,ppt无需修改。也可以使用这个语法。
curve(Vectorize(ppt)(x, tail = 0.2), ylab = "ppt")
页面原文内容由Stack Overflow提供。腾讯云小微IT领域专用引擎提供翻译支持
原文链接:
https://stackoverflow.com/questions/71355091
复制相关文章
相似问题
腾讯云开发者

Copyright © 2013 - 2026 Tencent Cloud. All Rights Reserved. 腾讯云 版权所有
深圳市腾讯计算机系统有限公司 ICP备案/许可证号:粤B2-20090059 ![]() 粤公网安备44030502008569号
粤公网安备44030502008569号
腾讯云计算(北京)有限责任公司 京ICP证150476号 | 京ICP备11018762号