
显微图像中以线状取向的析出物的去除
显微图像中以线状取向的析出物的去除
提问于 2022-03-03 11:14:09
我有一些显微图像,其中有沉淀在single状态,在一些我们有水平或垂直线。现在我该怎么删除这些线呢?
import matplotlib.pyplot as plt
import numpy as np
from scipy import ndimage as ndi
import cv2
import math
from skimage import (
color, feature, filters, measure, morphology, segmentation, util
)


# Sample1 - T61
image = cv2.imread(r"C:\Users\Stelle1.tif",cv2.IMREAD_GRAYSCALE)
assert not isinstance(image,type(None)), 'image not found'

fig, ax = plt.subplots()
ax.imshow(image, cmap='gray')
ax.axis('off')
plt.imshow()
fig, ax = plt.subplots(figsize=(5, 5))
qcs = ax.contour(image, origin='image')
ax.axis('off')
plt.show()

thresholds = filters.threshold_multiotsu(image, classes=3)
regions = np.digitize(image, bins=thresholds)

fig, ax = plt.subplots(ncols=2, figsize=(10, 5))
ax[0].imshow(image)
ax[0].set_title('Original')
ax[0].axis('off')
ax[1].imshow(regions)
ax[1].set_title('Multi-Otsu thresholding')
ax[1].axis('off')
plt.show()


cells = image > thresholds[0]
dividing = image > thresholds[1]
labeled_cells = measure.label(cells)
labeled_dividing = measure.label(dividing)
naive_mi = labeled_dividing.max() / labeled_cells.max()
print(naive_mi)

higher_threshold = 100
dividing = image > higher_threshold

smoother_dividing = filters.rank.mean(util.img_as_ubyte(dividing),
                                  morphology.disk(4))

binary_smoother_dividing = smoother_dividing > 20

fig, ax = plt.subplots(figsize=(5, 5))
ax.imshow(binary_smoother_dividing)
ax.set_title('Dividing precipitate')
ax.axis('off')
plt.show()
这是我得到的,如果我增加higher_threshold = 100,我将失去椭圆形状沉淀物,我需要计数面积和其他属性。你能提出一些解决方案,即算法不应该检测线状沉淀物?
回答 1
Stack Overflow用户
发布于 2022-03-19 00:13:59
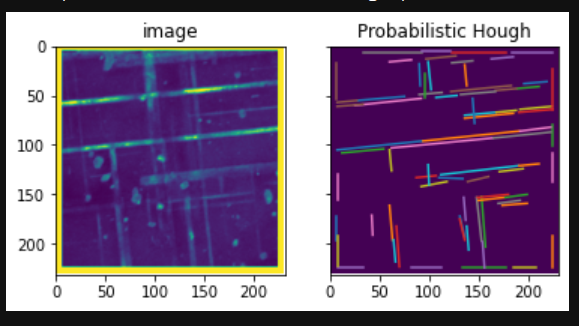
你考虑过使用像霍夫变换这样的方法来检测直线吗?:transform.html
基本上,我从上面的教程中直接提高了这一点,并得到了一些相当不错的结果。
from skimage import io
from skimage.transform import probabilistic_hough_line
from skimage.feature import canny


img = io.imread('GsSj9.png', as_gray=True) # read in the image
edges = canny(img) # use canny filter to detect edges
lines = probabilistic_hough_line(edges, threshold=20, line_length=20, line_gap=3)

# make plot of image and probabilistic_hough_line
fig, axes = plt.subplots(1, 2, sharex=True, sharey=True)
ax = axes.ravel()

ax[0].imshow(img)
ax[0].set_title('image')
ax[1].imshow(img * 0)
for line in lines:
    p0, p1 = line
    ax[1].plot((p0[0], p1[0]), (p0[1], p1[1]))
ax[1].set_xlim((0, img.shape[1]))
ax[1].set_ylim((img.shape[0], 0))
ax[1].set_title('Probabilistic Hough')
您仍然需要找到一种从转换线生成二进制图像的好方法,但是它在您的工作中可能是有用的。
页面原文内容由Stack Overflow提供。腾讯云小微IT领域专用引擎提供翻译支持
原文链接:
https://stackoverflow.com/questions/71336190
复制相关文章
相似问题
腾讯云开发者

Copyright © 2013 - 2026 Tencent Cloud. All Rights Reserved. 腾讯云 版权所有
深圳市腾讯计算机系统有限公司 ICP备案/许可证号:粤B2-20090059 ![]() 粤公网安备44030502008569号
粤公网安备44030502008569号
腾讯云计算(北京)有限责任公司 京ICP证150476号 | 京ICP备11018762号