
检测社区生成子图的网络熵
在复杂网络分析中,我有4种统计计算函数。
import networkx as nx
import numpy as np
import math
from astropy.io import fits
图的度分布:
def degree_distribution(G):
    vk = dict(G.degree())
    vk = list(vk.values()) # we get only the degree values
    maxk = np.max(vk)
    mink = np.min(min)
    kvalues= np.arange(0,maxk+1) # possible values of k
    Pk = np.zeros(maxk+1) # P(k)
    for k in vk:
        Pk[k] = Pk[k] + 1
    Pk = Pk/sum(Pk) # the sum of the elements of P(k) must to be equal to one

    return kvalues,Pk
图形的社区检测:
def calculate_community_modularity(graph):

    communities = greedy_modularity_communities(graph) # algorithm
    modularity_dict = {} # Create a blank dictionary

    for i,c in enumerate(communities): # Loop through the list of communities, keeping track of the number for the community
        for name in c: # Loop through each neuron in a community
            modularity_dict[name] = i # Create an entry in the dictionary for the neuron, where the value is which group they belong to.

    nx.set_node_attributes(graph, modularity_dict, 'modularity')

    print (graph_name)
    for i,c in enumerate(communities): # Loop through the list of communities
        #if len(c) > 2: # Filter out modularity classes with 2 or fewer nodes
            print('Class '+str(i)+':', len(c)) # Print out the classes and their member numbers
    return modularity_dict
图的模块化分数:
def modularity_score(graph):
    return nx_comm.modularity(graph, nx_comm.label_propagation_communities(graph))
最后,图熵:
def shannon_entropy(G):
    k,Pk = degree_distribution(G)
    H = 0
    for p in Pk:
        if(p > 0):
            H = H - p*math.log(p, 2)
    return H
问题
我现在想要实现的是找到每个社区的局部熵(变成一个子图),并保留边缘信息。
这个是可能的吗?怎么会这样呢?
编辑
正在使用的矩阵在此链接中:
with fits.open('mind_dataset/matrix_CEREBELLUM_large.fits') as data:
    matrix = pd.DataFrame(data[0].data.byteswap().newbyteorder())
然后将邻接矩阵转换为图、“图”或“G”,如下所示:
def matrix_to_graph(matrix):
    from_matrix = matrix.copy()
    to_numpy = from_matrix.to_numpy()
    G = nx.from_numpy_matrix(to_numpy)
    return G
编辑2
根据下面提出的答案,我创建了另一个功能:
def community_entropy(modularity_dict):
    communities = {}

    #create communities as lists of nodes
    for node, community in modularity_dict.items():
        if community not in communities.keys():
            communities[community] = [node]
        else:
            communities[community].append(node)

    print(communities)
    #transform lists of nodes to actual subgraphs
    for subgraph, community in communities.items():
        communities[community] = nx.Graph.subgraph(subgraph)

    local_entropy = {}
    for subgraph, community in communities.items():
        local_entropy[community] = shannon_entropy(subgraph)

    return local_entropy
以及:
cerebellum_graph = matrix_to_graph(matrix)
modularity_dict_cereb = calculate_community_modularity(cerebellum_graph)
community_entropy_cereb = community_entropy(modularity_dict_cereb)
但是它抛出了一个错误:
TypeError:子图()缺少一个必需的位置参数:“节点”
回答 2
Stack Overflow用户
发布于 2022-01-29 17:48:02
使用我提供的代码来回答您的问题,这里可以从社区创建图表。您可以首先为每个社区创建不同的图表(基于图形的社区边缘属性)。然后,您可以使用shannon_entropy和degree_distribution函数计算每个社区的熵。
请参阅下面基于您在上述其他问题中提供的空手道俱乐部示例的代码:
import networkx as nx
import networkx.algorithms.community as nx_comm
import matplotlib.pyplot as plt
import numpy as np
import math
def degree_distribution(G):
vk = dict(G.degree())
vk = list(vk.values()) # we get only the degree values
maxk = np.max(vk)
mink = np.min(min)
kvalues= np.arange(0,maxk+1) # possible values of k
Pk = np.zeros(maxk+1) # P(k)
for k in vk:
Pk[k] = Pk[k] + 1
Pk = Pk/sum(Pk) # the sum of the elements of P(k) must to be equal to one
return kvalues,Pk
def shannon_entropy(G):
k,Pk = degree_distribution(G)
H = 0
for p in Pk:
if(p > 0):
H = H - p*math.log(p, 2)
return H
G = nx.karate_club_graph()
# Find the communities
communities = sorted(nx_comm.greedy_modularity_communities(G), key=len, reverse=True)
# Count the communities
print(f"The club has {len(communities)} communities.")
'''Add community to node attributes'''
for c, v_c in enumerate(communities):
for v in v_c:
# Add 1 to save 0 for external edges
G.nodes[v]['community'] = c + 1
'''Find internal edges and add their community to their attributes'''
for v, w, in G.edges:
if G.nodes[v]['community'] == G.nodes[w]['community']:
# Internal edge, mark with community
G.edges[v, w]['community'] = G.nodes[v]['community']
else:
# External edge, mark as 0
G.edges[v, w]['community'] = 0
N_coms=len(communities)
edges_coms=[]#edge list for each community
coms_G=[nx.Graph() for _ in range(N_coms)] #community graphs
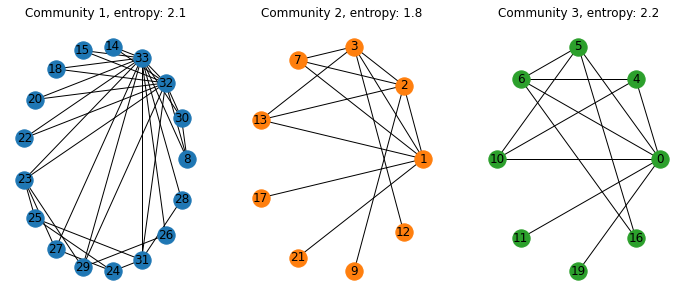
colors=['tab:blue','tab:orange','tab:green']
fig=plt.figure(figsize=(12,5))
for i in range(N_coms):
edges_coms.append([(u,v,d) for u,v,d in G.edges(data=True) if d['community'] == i+1])#identify edges of interest using the edge attribute
coms_G[i].add_edges_from(edges_coms[i]) #add edges
ent_coms=[shannon_entropy(coms_G[i]) for i in range(N_coms)] #Compute entropy
for i in range(N_coms):
plt.subplot(1,3,i+1)#plot communities
plt.title('Community '+str(i+1)+ ', entropy: '+str(np.round(ent_coms[i],1)))
pos=nx.circular_layout(coms_G[i])
nx.draw(coms_G[i],pos=pos,with_labels=True,node_color=colors[i]) 输出结果是:
Stack Overflow用户
发布于 2022-01-26 14:51:52
看起来,在calculate_community_modularity中,您可以使用greedy_modularity_communities创建一个dict,modularity_dict,它将图形中的一个节点映射到community。如果我正确理解,您可以将modularity_dict中的每个子图社区传递给shannon_entropy,以计算该社区的熵。
伪码
这是伪代码,所以可能有一些错误。不过,这应能传达这一原则。
在运行calculate_community_modularity之后,您有这样一个分块,其中键是每个节点,值是社区所属的
modularity_dict = {node_1: community_1, node_2: community_1, node_3: community_2}我从未使用过nx,但看起来您可以使用基于节点列表提取子图。因此,您将遍历dict,并为每个社区创建一个节点列表。然后,您将使用该节点列表提取该社区的实际nx子图。
communities = {}

#create communities as lists of nodes
for node, community in modularity_dict.iteritems():
    if community not in communities.keys():
        communities[community] = [node]
    else:
        communities[community].append(node)

#transform lists of nodes to actual subgraphs
for subgraph, community in communities.iteritems():
communities[community] = networkx.Graph.subgraph(subgraph)既然communities是一个带有社区id键的迪克,以及定义该社区的nx子图的值,那么您应该能够通过shannon_entropy运行这些子图,因为子图的类型与原始图的类型相同。
local_entropy = {}
for subgraph, community in communities.iteritems():
local_entropy[community] = shannon_entropy(subgraph)https://stackoverflow.com/questions/70858169
复制相似问题
腾讯云开发者

Copyright © 2013 - 2026 Tencent Cloud. All Rights Reserved. 腾讯云 版权所有
深圳市腾讯计算机系统有限公司 ICP备案/许可证号:粤B2-20090059 ![]() 粤公网安备44030502008569号
粤公网安备44030502008569号
腾讯云计算(北京)有限责任公司 京ICP证150476号 | 京ICP备11018762号