
将行进立方体中的索引转换为原始的x,y,z空间--可视化等深线三维图像
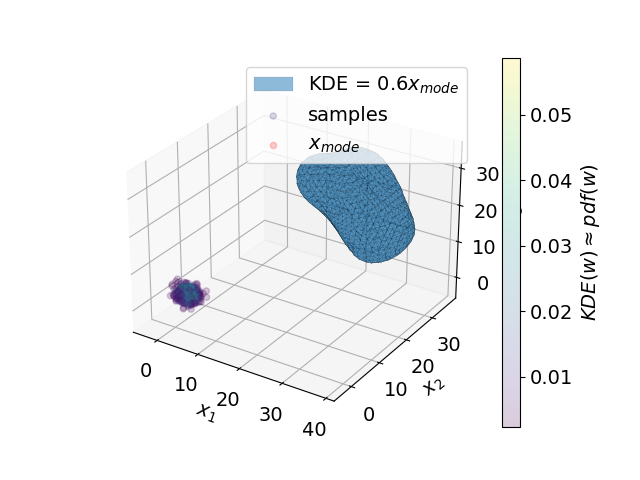
我想在x1,x2,x3空间中画一个卷。该体积是由an图像中的行进立方体算法发现的一个等值线。生成卷的函数是pdf_grid = f(x1,x2,x3)和
我想要绘制的体积,其中pdf = 60%的最大值(Pdf)。
我的问题是,行进立方体算法生成顶点和面,但是如何将它们映射回x1、x2、x3空间?
我对行进立方体(相当有限)的理解是,“顶点”指卷中的索引(在我的例子中是pdf_grid)。如果“顶点”只包含网格中的确切索引,这会很容易,但是“顶点”包含的是浮点数而不是整数。似乎行军立方体在网格点之间做了一些插值(根据https://www.cs.carleton.edu/cs_comps/0405/shape/marching_cubes.html),那么问题是如何准确地恢复x1、x2、x3的值?
import numpy as np
import scipy.stats
import matplotlib.pyplot as plt

#Make some random data
cov = np.array([[1, .2, -.5],
                [.2, 1.2, .1],
                [-.5, .1, .8]])
dist = scipy.stats.multivariate_normal(mean = [1., 3., 2], cov = cov)
N = 500
x_samples = dist.rvs(size=N).T

#Create the kernel density estimator - approximation of a pdf
kernel = scipy.stats.gaussian_kde(x_samples)
x_mean = x_samples.mean(axis=1)
#Find the mode
res = scipy.optimize.minimize(lambda x: -kernel.logpdf(x),
                                 x_mean #x0, initial guess
                                 )
x_mode = res["x"]

num_el = 50 #number of elements in the grid
x_min = np.min(x_samples, axis = 1)
x_max = np.max(x_samples, axis = 1)
x1g, x2g, x3g = np.mgrid[x_min[0]:x_max[0]:num_el*1j,
                         x_min[1]:x_max[1]:num_el*1j,
                         x_min[2]:x_max[2]:num_el*1j
                         ]

pdf_grid = np.zeros(x1g.shape) #implicit function/grid for the marching cubes
for an in range(x1g.shape[0]):
    for b in range(x1g.shape[1]):
        for c in range(x1g.shape[2]):
            pdf_grid[a,b,c] = kernel(np.array([x1g[a,b,c],
                                      x2g[a,b,c],
                                      x3g[a,b,c]]
                                      ))

from mpl_toolkits.mplot3d.art3d import Poly3DCollection
from skimage import measure

iso_level = .6 #draw a volume which contains pdf_val(mode)*60%
verts, faces, normals, values = measure.marching_cubes(pdf_grid, kernel(x_mode)*iso_level)

#How to convert the figure back to x1,x2,x3 space? I just draw the output as it was done in the skimage example here https://scikit-image.org/docs/0.16.x/auto_examples/edges/plot_marching_cubes.html#sphx-glr-auto-examples-edges-plot-marching-cubes-py so you can see the volume

# Fancy indexing: `verts[faces]` to generate a collection of triangles
mesh = Poly3DCollection(verts[faces],
                        alpha = .5,
                        label = f"KDE = {iso_level}"+r"$x_{mode}$",
                        linewidth = .1)
mesh.set_edgecolor('k')


fig, ax = plt.subplots(subplot_kw=dict(projection='3d'))

c1 = ax.add_collection3d(mesh)
c1._facecolors2d=c1._facecolor3d
c1._edgecolors2d=c1._edgecolor3d

#Plot the samples. Marching cubes volume does not capture these samples
pdf_val = kernel(x_samples) #get density value for each point (for color-coding)
x1, x2, x3 = x_samples
scatter_plot = ax.scatter(x1, x2, x3, c=pdf_val, alpha = .2, label = r" samples")
ax.scatter(x_mode[0], x_mode[1], x_mode[2], c = "r", alpha = .2, label = r"$x_{mode}$")

ax.set_xlabel(r"$x_1$")
ax.set_ylabel(r"$x_2$")
ax.set_zlabel(r"$x_3$")
# ax.set_box_aspect([np.ptp(i) for me in x_samples])  # equal aspect ratio

cbar = fig.color bar(scatter_plot, ax=ax)
cbar.set_label(r"$KDE(w) \approx pdf(w)$")
ax.legend()

#Make the axis limit so that the volume and samples are shown.
ax.set_xlim(- 5, np.max(verts, axis=0)[0] + 3)
ax.set_ylim(- 5, np.max(verts, axis=0)[1] + 3)
ax.set_zlim(- 5, np.max(verts, axis=0)[2] + 3)
回答 1
Stack Overflow用户
发布于 2022-11-24 18:05:47
这可能是太晚的答案,以帮助OP,但如果其他人看到这个问题的解决方案,这个问题源于列队立方体算法输出相关的顶点在数组空间。这个空间是由网格网格的每个维的元素数定义的,而行进立方体算法确实在这个空间中做了一些插值(解释浮动的存在)。
无论如何,为了将顶点转换回x1,x2,x3空间,只需按适当的量进行缩放和移动。这些量分别由网格网格的范围、元素数和每个维度中的最小值来定义。因此,使用OP中定义的变量,下面将提供顶点的实际位置:
verts_actual = verts*((x_max-x_min)/pdf_grid.shape) + x_minhttps://stackoverflow.com/questions/70834443
复制相似问题
腾讯云开发者

Copyright © 2013 - 2026 Tencent Cloud. All Rights Reserved. 腾讯云 版权所有
深圳市腾讯计算机系统有限公司 ICP备案/许可证号:粤B2-20090059 ![]() 粤公网安备44030502008569号
粤公网安备44030502008569号
腾讯云计算(北京)有限责任公司 京ICP证150476号 | 京ICP备11018762号