
是否可以不依赖于数据集的长度和缩放,来改变比例尺上滴答的频率?
是否可以不依赖于数据集的长度和缩放,来改变比例尺上滴答的频率?
提问于 2019-09-12 09:41:53
当我用matplotlib绘制数据时,我的x轴上总是有5-9个滴答,与我绘制的范围无关,如果我放大x轴,滴答间距就会减小,所以我仍然会看到5-9个滴答。
不过,我想在我的x轴20-30滴答!
我可以做到以下几点:
from matplotlib import pyplot as plt
import numpy as np

x = [5, 10, 15, 20, 25, 30, 35, 40, 45, 50]
y = [1, 4, 3, 2, 7, 6, 9, 8, 10, 5]

number_of_ticks_on_x_axis = 20

plt.plot(x, y)
plt.xticks(np.arange(min(x), max(x)+1, (max(x) - min(x))/number_of_ticks_on_x_axis))

plt.show()
如果我现在放大x轴,在现有的轴之间不会出现新的刻度.不管我放大多远,我还是希望有20只蜱。
回答 2
Stack Overflow用户
回答已采纳
发布于 2019-09-12 11:46:41
假设你想修正“不”。X轴上的蜱
...
from matplotlib.ticker import MaxNLocator
...
fig, ax = plt.subplots()
ax.xaxis.set_major_locator(MaxNLocator(15, min_n_ticks=15))
...请看文档 for MaxNLocator
示例
In [36]: import numpy as np
...: import matplotlib.pyplot as plt
In [37]: from matplotlib.ticker import MaxNLocator
In [38]: fig, ax = plt.subplots(figsize=(10,4))
In [39]: ax.grid()
In [40]: ax.xaxis.set_major_locator(MaxNLocator(min_n_ticks=15))
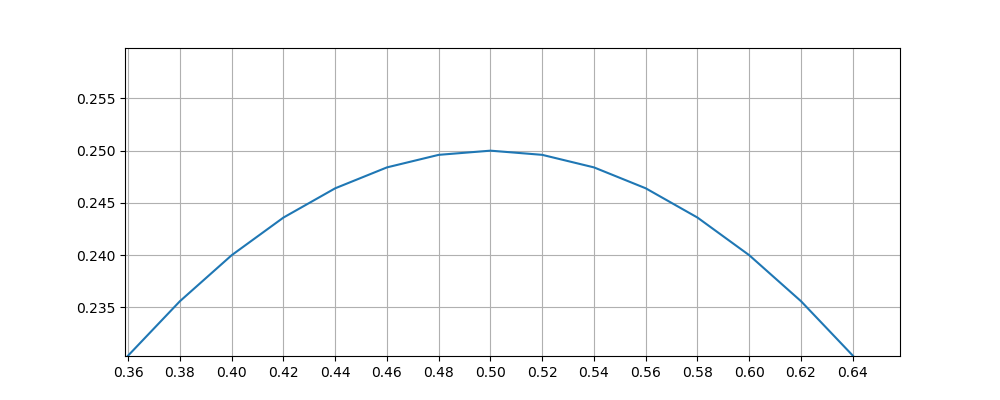
In [41]: x = np.linspace(0, 1, 51)
In [42]: y = x*(1-x)
In [43]: plt.plot(x, y)
Out[43]: [<matplotlib.lines.Line2D at 0x7f9eab409e10>]给出

当我放大到曲线的最大值时
Stack Overflow用户
发布于 2019-09-12 11:13:01
可以将回调函数链接到画布中的事件。在这种情况下,您可以触发一个函数,该函数在重绘发生时更新轴。
from matplotlib import pyplot as plt
import numpy as np

x = [5, 10, 15, 20, 25, 30, 35, 40, 45, 50]
y = [1, 4, 3, 2, 7, 6, 9, 8, 10, 5]

n = 20

plt.plot(x, y)
plt.xticks(np.arange(min(x), max(x)+1, (max(x) - min(x))/n), rotation=90)

def on_zoom(event):
    ax = plt.gca()
    fig = plt.gcf()
    x_min, x_max = ax.get_xlim()
    ax.set_xticks(np.linspace(x_min, x_max, n))
    # had to add flush_events to get the ticks to redraw on the last update.
    fig.canvas.flush_events()

fig = plt.gcf()
fig.canvas.mpl_disconnect(cid)
cid = fig.canvas.mpl_connect('draw_event', on_zoom)页面原文内容由Stack Overflow提供。腾讯云小微IT领域专用引擎提供翻译支持
原文链接:
https://stackoverflow.com/questions/57903940
复制相关文章
相似问题
腾讯云开发者

Copyright © 2013 - 2026 Tencent Cloud. All Rights Reserved. 腾讯云 版权所有
深圳市腾讯计算机系统有限公司 ICP备案/许可证号:粤B2-20090059 ![]() 粤公网安备44030502008569号
粤公网安备44030502008569号
腾讯云计算(北京)有限责任公司 京ICP证150476号 | 京ICP备11018762号