
计算图像中不规则物体所覆盖的面积
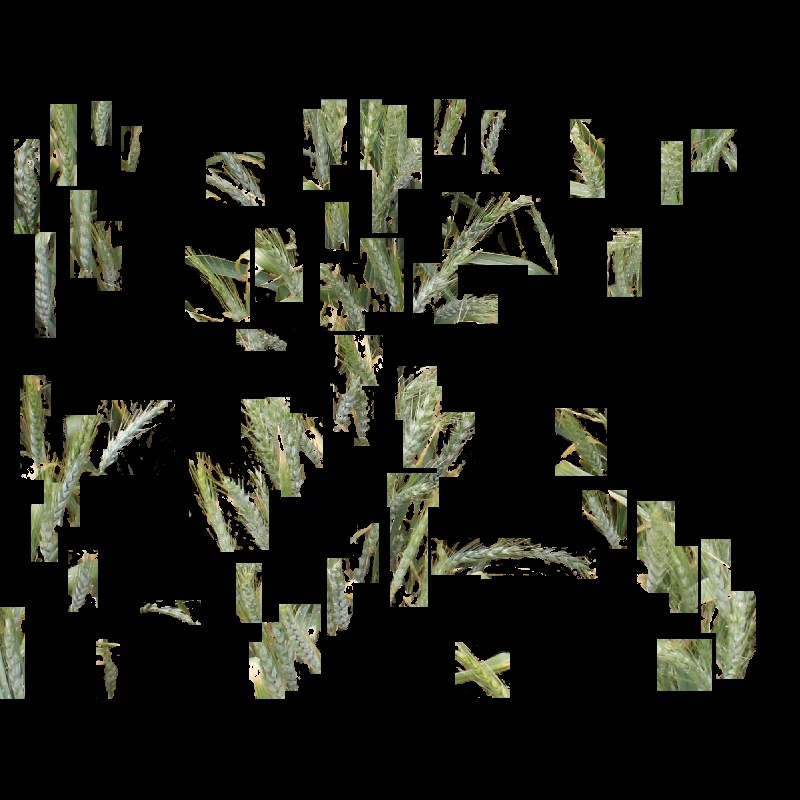
我正在做一个项目,根据图像中的小麦峰值来估算小麦产量。在使用更快的RCNN和基于颜色的分割来检测尖峰之后,下面是在图像中只有尖峰的结果图像。

现在,我的目标是使用python估计图像中的尖峰产生的产量。为此,我们可能需要计算多边形形状对象所覆盖的面积,或者我们可能需要围绕像素值来计算该区域。但我不知道我们怎么能做到。如果有人有解决办法,请告诉我。谢谢
回答 2
Stack Overflow用户
发布于 2019-09-07 05:22:03
通过创建二进制掩码,可以找到图像中以像素为单位的非黑色区域。以像素为单位的面积等于掩码中白色像素的总数。一种方法是计算图像中白色像素的分数。然后,白色像素的数量将是图像的分数*宽度*高度。该分数只是图像的平均值除以最大可能的灰度水平(255)。所以
白色像素的面积=(平均/255个)_width_height
因此,获得二值掩码图像的分式平均值(平均值/255)(通过在0处进行阈值处理)。平均值的结果将是一个单一值。然后乘以图像的宽度,然后乘以图像的高度。该结果将等于掩码中白色像素的总数,从而等于图像中非黑色(即有色)的总像素数。白色像素数是图像中非黑色像素的像素区域。
输入:
import cv2
import numpy as np
img = cv2.imread('img.jpg')
height = img.shape[0]
width = img.shape[1]
gray = cv2.cvtColor(img,cv2.COLOR_BGR2GRAY)
ret, thresh = cv2.threshold(gray,0,255,cv2.THRESH_BINARY)
cv2.imshow("Mask", thresh)
cv2.waitKey(0)
cv2.destroyAllWindows()
ave = cv2.mean(thresh)[0]/255
print(ave)
0.310184375
area = ave*height*width
print(area)
198518.0
请注意,这是非黑色像素区域。你的一些长方形里面有黑色。这不是矩形的面积。在隔离矩形以获得矩形区域之前,您必须确保图像没有黑色像素。
加法
Mark提出的一种更简单的方法是简单地计算阈值图像中的非零像素数。它计算的数字与上面相同。
import cv2
import numpy as np
img = cv2.imread('img.jpg')
gray = cv2.cvtColor(img,cv2.COLOR_BGR2GRAY)
ret, thresh = cv2.threshold(gray,0,255,cv2.THRESH_BINARY)
cv2.imshow("Mask", thresh)
cv2.waitKey(0)
cv2.destroyAllWindows()
area2 = cv2.countNonZero(thresh)
print(area2)
198518
加法2
如果您知道与图像所涵盖的区域相对应的地面面积或以米为单位的尺寸(按您的注释计算为0.8米),则与非零像素计数相对应的地面区域为:
area on ground for nonzero pixels = count * 0.8 * 0.8 / (width * height)其中宽度和高度是图像的像素尺寸。
import cv2
import numpy as np
img = cv2.imread('img.jpg')
height = img.shape[0]
width = img.shape[1]
gray = cv2.cvtColor(img,cv2.COLOR_BGR2GRAY)
ret, thresh = cv2.threshold(gray,0,255,cv2.THRESH_BINARY)
cv2.imshow("Mask", thresh)
cv2.waitKey(0)
cv2.destroyAllWindows()
count = cv2.countNonZero(thresh)
area = count*0.8*0.8/(width*height)
print(area)
0.19851800000000003
结果是0.198518平方米。
Stack Overflow用户
发布于 2019-09-07 15:26:00
希望这能有所帮助
- 在灰度
(0[Black] - 255[White])中加载图像 - 提取高于一定水平的像素。我拥有的不仅仅是使用
60的cv2.threshold - 使用最小内核
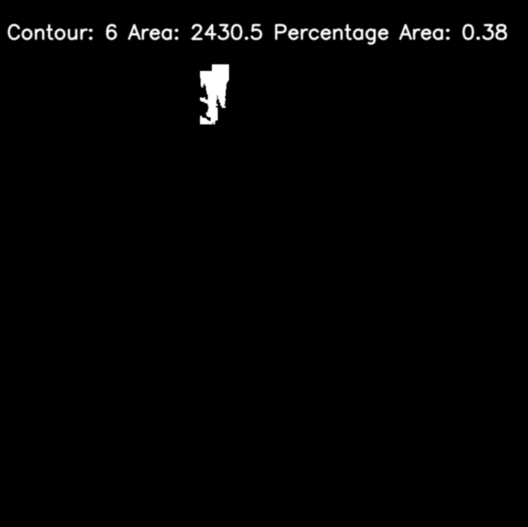
(3,3)使用cv2.morphologyEx(thresh, cv2.MORPH_OPEN, kernel)填充小白点 - 从阈值图像中提取轮廓
- 按反向顺序遍历每个轮廓(右上至右下角)
- 在遍历每个等高线时,计算其属性
代码
import cv2
import numpy as np
from matplotlib import pyplot as plt

img = cv2.imread('RIUXF.jpg',0)
hist = cv2.calcHist([img],[0],None,[256],[0,256])

# Area occupied by black region
black_area = np.true_divide(hist[0],np.prod(img.shape))[0]*100

# extract no black parts
thresh = cv2.threshold(img,60,255,cv2.THRESH_BINARY)[1]
kernel = np.ones((3,3),np.uint8)

# fill in the small white spots
opening = cv2.morphologyEx(thresh, cv2.MORPH_OPEN, kernel)

# extract the contours
contours = cv2.findContours(opening, cv2.RETR_TREE, cv2.CHAIN_APPROX_SIMPLE)[0]

blank_image = np.zeros((img.shape),np.uint8)
image_area = np.prod(img.shape)

# iterate through the contours detected from right top corner
for i,c in enumerate(contours[::-1]):

    # turn blank_image black
    blank_image *= 0

    # draw filled contour
    cv2.drawContours(blank_image, [c], 0, (255), thickness=cv2.FILLED)

    contour_area = cv2.contourArea(c)

    # percentage of area contour
    contour_area_pc = np.true_divide(int(contour_area),image_area)*100 if int(contour_area) > 1  else 0
    text = ' '.join(['Contour:',str(i),'Area:',str(round(contour_area,2)),'Percentage Area:',str(round(contour_area_pc,2))])
    cv2.putText(blank_image,text,(10,60), cv2.FONT_HERSHEY_SIMPLEX, 1,(255),2,cv2.LINE_AA)

    plt.imshow(blank_image, cmap = 'gray', interpolation = 'bicubic')
    plt.xticks([]), plt.yticks([])  # to hide tick values on X and Y axis
    plt.show()
样本输出
PS:我怀疑cv2计算区域是否正确
https://stackoverflow.com/questions/57830697
复制相似问题
腾讯云开发者

Copyright © 2013 - 2026 Tencent Cloud. All Rights Reserved. 腾讯云 版权所有
深圳市腾讯计算机系统有限公司 ICP备案/许可证号:粤B2-20090059 ![]() 粤公网安备44030502008569号
粤公网安备44030502008569号
腾讯云计算(北京)有限责任公司 京ICP证150476号 | 京ICP备11018762号