
如何将来自不同数据帧的选定列的数据绘制成子图?
如何将来自不同数据帧的选定列的数据绘制成子图?
提问于 2019-08-26 12:31:18
我想要制作一个由两行图组成的子图,这两幅图中的每一幅都应该从不同的数据帧绘制列。
第一个子图应该将所有列显示在一个与行相同的数据框架(curves1_monthly)中。另一个子图应该将另一个数据帧(curves2_yearly)中的两列表示为行。因此,这两个数据集/帧的分辨率是不同的。
格式的curves1_monthly:
    Date                       Col1   ...     Col9
0   2000-01-01 00:00:00+01:00  0.45   ...     0.34
1   2000-02-01 00:00:00+01:00  0.56   ...     0.72
2   2000-03-01 00:00:00+01:00  0.12   ...     0.04
3   2000-04-01 00:00:00+02:00  0.57   ...     0.98
4   2000-05-01 00:00:00+02:00  0.39   ...     0.63
.   ...                        ...    ...     ...
.   ...                        ...    ...     ...
格式的curves2_yearly:
Date        Column1       Column2
2000        45.50         2.40
2001        46.70         7.00
2002        50.20         1.20
2003        32.40         3.40
2004        38.90         6.90
.           .             .
.           .             .
.           .             .
我的绘图功能:
def plot_curves(curves1_monthly, curves2_yearly):
    fig, axes = plt.subplots(nrows=1, ncols=2)
    # First subplot: all columns in df curves1_monthly except the
    # 'Date' col:
    for curve_name in curves1_monthly[1:]:
        curves1_monthly.plot(kind='line', y=curve_name, ax=axes[0,
                                                                0])
    # Second subplot:
    curves2_yearly.plot(kind='line', x='Date', y='Column1',
                                                  ax=axes[0, 1])
    curves2_yearly.plot(kind='line', x='Date', y='Column2',
                                                  ax=axes[0, 1])
我做这个的时候,
我收到以下错误消息:
plot_curves curves1_monthly.plot( y=curve_name,ax=axes0,0)中的文件“/Users/./my_Program.py”,第46行:数组索引太多
这里怎么了?
回答 1
Stack Overflow用户
发布于 2019-08-26 12:55:15
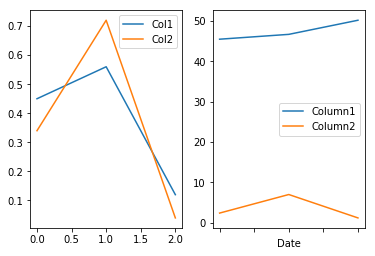
我认为,总的来说,只是axes指数略有下降。当有一行绘图时,只需对列号进行索引,类似于这个例子。此外,您还可以使用Pandas的plot函数为您完成许多工作:
def plot_curves(curves1_monthly, curves2_yearly):
    fig, axes = plt.subplots(nrows=1, ncols=2)
    # First subplot:
    curves1_monthly.plot(kind='line', ax=axes[0])
    # Second subplot:
    curves2_yearly.plot(kind='line', x='Date', ax=axes[1])
希望您所寻找的内容与下面的内容类似:
页面原文内容由Stack Overflow提供。腾讯云小微IT领域专用引擎提供翻译支持
原文链接:
https://stackoverflow.com/questions/57657975
复制相关文章
相似问题
腾讯云开发者

Copyright © 2013 - 2026 Tencent Cloud. All Rights Reserved. 腾讯云 版权所有
深圳市腾讯计算机系统有限公司 ICP备案/许可证号:粤B2-20090059 ![]() 粤公网安备44030502008569号
粤公网安备44030502008569号
腾讯云计算(北京)有限责任公司 京ICP证150476号 | 京ICP备11018762号