
有光泽的活动板
有光泽的活动板
提问于 2019-08-22 07:29:05
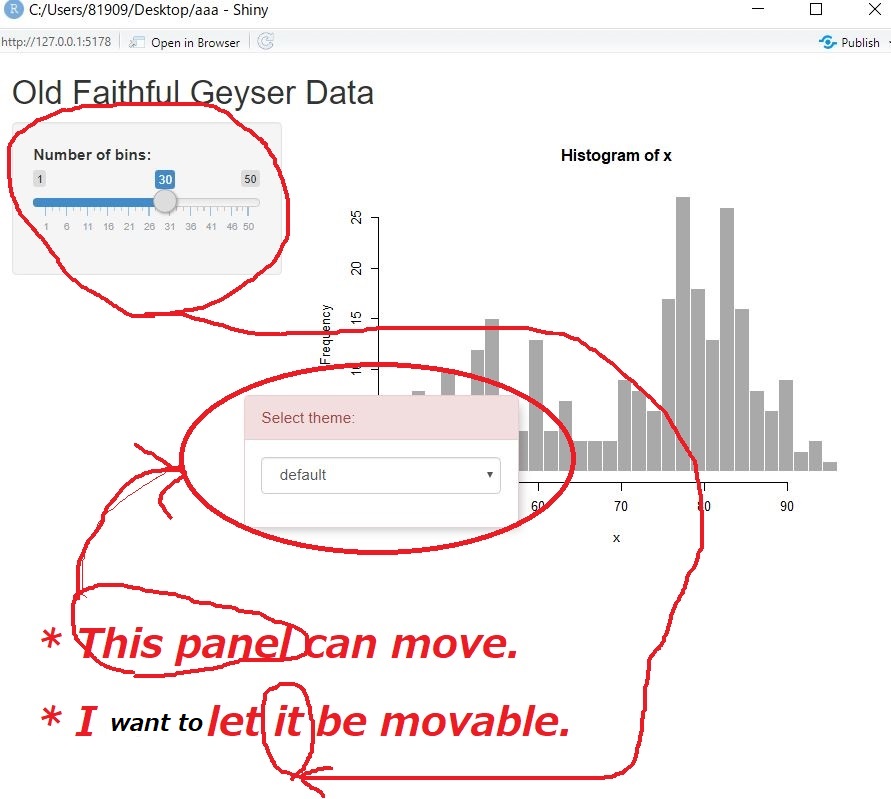
在下面的代码中,是否可以将bins放在可移动的面板中,比如颜色更改面板。
折叠图像显示一个面板是可移动的,而另一个是不可移动的。
library(shiny)


# Define UI for application that draws a histogram
ui <- fluidPage(
  shiny::tags$head(
    shinythemes::themeSelector()

  ),#taghead
  # Application title
  titlePanel("Old Faithful Geyser Data"),

  # Sidebar with a slider input for number of bins
  sidebarLayout(
    sidebarPanel(
      sliderInput("bins",
                  "Number of bins:",
                  min = 1,
                  max = 50,
                  value = 30)
    ),

    # Show a plot of the generated distribution
    mainPanel(
      plotOutput("distPlot")
    )
  )
)

# Define server logic required to draw a histogram
server <- function(input, output) {

  output$distPlot <- renderPlot({
    # generate bins based on input$bins from ui.R
    x    <- faithful[, 2]
    bins <- seq(min(x), max(x), length.out = input$bins + 1)

    # draw the histogram with the specified number of bins
    hist(x, breaks = bins, col = 'darkgray', border = 'white')
  })
}

# Run the application
shinyApp(ui = ui, server = server)
如何制作可移动面板?请让我知道。
**Answer: The following code makes a draggable panel**


library(shiny)

# Define UI for application that draws a histogram
ui <- fluidPage(
  shiny::tags$head(
    shinythemes::themeSelector()

  ),#taghead
  # Application title
  titlePanel("Old Faithful Geyser Data"),

  # Sidebar with a slider input for number of bins


    # Show a plot of the generated distribution
    mainPanel(

      absolutePanel(
        sliderInput("bins",
                    "Number of bins:",
                    min = 1,
                    max = 50,
                    value = 30),
        draggable = T
      ),
      plotOutput("distPlot")
    )

)

# Define server logic required to draw a histogram
server <- function(input, output) {

  output$distPlot <- renderPlot({
    # generate bins based on input$bins from ui.R
    x    <- faithful[, 2]
    bins <- seq(min(x), max(x), length.out = input$bins + 1)

    # draw the histogram with the specified number of bins
    hist(x, breaks = bins, col = 'darkgray', border = 'white')
  })
}

# Run the application
shinyApp(ui = ui, server = server)回答 1
Stack Overflow用户
回答已采纳
发布于 2019-08-22 09:04:50
可移动面板可以用absolutePanel实现。
页面原文内容由Stack Overflow提供。腾讯云小微IT领域专用引擎提供翻译支持
原文链接:
https://stackoverflow.com/questions/57604130
复制相关文章
相似问题
腾讯云开发者

Copyright © 2013 - 2026 Tencent Cloud. All Rights Reserved. 腾讯云 版权所有
深圳市腾讯计算机系统有限公司 ICP备案/许可证号:粤B2-20090059 ![]() 粤公网安备44030502008569号
粤公网安备44030502008569号
腾讯云计算(北京)有限责任公司 京ICP证150476号 | 京ICP备11018762号