
mpld3错误: AttributeError:'list‘对象没有属性’画布‘
mpld3错误: AttributeError:'list‘对象没有属性’画布‘
提问于 2019-08-09 08:53:43
我试图使用mpld3库在浏览器上绘制Matplotlib数据。但我遇到的问题是,我得到了以下错误:
如果fig.canvas为None: AttributeError:'list‘对象没有属性’画布‘
这些是我导入的mpld3对象。
import matplotlib.pyplot as plt,mpld3
from mpld3 import save_json, fig_to_html, plugins
下面是我用HTML保存图形的代码。
plt.subplots(1, 1, figsize=(8, 2))
ecg = X
fig=plt.figure()
alt = np.arange(len(ecg))/125
fig= plt.plot(alt,ecg)
mpld3.save_html(fig,"test.html")
mpld3.fig_to_html(fig,template_type="simple")
mpld3.disable_notebook()
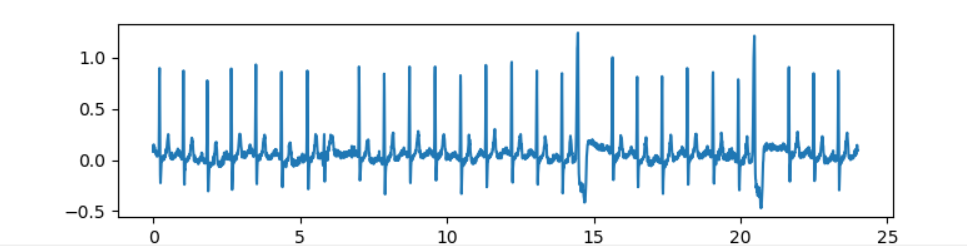
mpld3.show()如果我没有将数据保存在html文件中,我将得到这个数字。html文件是创建的,但是是空的,上面提到的错误正在控制台上显示。
请帮帮忙。任何帮助都是非常感谢的
这是它看上去的数字。
回答 1
Stack Overflow用户
发布于 2019-08-09 10:21:50
通过遵循文档这里,我能够获得发送到html文件的情节,如下所示:
import matplotlib.pyplot as plt,mpld3
from mpld3 import save_json, fig_to_html, plugins, save_html
import numpy as np

X = 'x'

fig, ax = plt.subplots(1, 1, figsize=(8, 2))
ecg = X
fig = plt.figure()
alt = np.arange(len(ecg))/125
lines = ax.plot(alt,ecg)
mpld3.plugins.connect(fig, mpld3.plugins.LineLabelTooltip(lines[0]))
mpld3.fig_to_html(fig)
mpld3.save_html(fig,"test.html")

# mpld3.disable_notebook()
mpld3.show()
你的路线
fig=plt.figure()

fig= plt.plot(alt,ecg)
不使用图方法,这就是为什么要获得“画布”错误的原因。
我不确定您的所有数据是什么,您可能不需要使用插件方法,但是切换保存html的顺序,并将图转换为html,似乎解决了一些问题。
希望这能有所帮助。
页面原文内容由Stack Overflow提供。腾讯云小微IT领域专用引擎提供翻译支持
原文链接:
https://stackoverflow.com/questions/57426599
复制相关文章
相似问题
腾讯云开发者

Copyright © 2013 - 2026 Tencent Cloud. All Rights Reserved. 腾讯云 版权所有
深圳市腾讯计算机系统有限公司 ICP备案/许可证号:粤B2-20090059 ![]() 粤公网安备44030502008569号
粤公网安备44030502008569号
腾讯云计算(北京)有限责任公司 京ICP证150476号 | 京ICP备11018762号