
Scipy.stats t矩提取问题
Scipy.stats t矩提取问题
提问于 2019-08-04 14:38:57
我正在尝试从一个学生中提取斜度和峰度,这是我对一些非正常数据的拟合。
提取平均值和stdev没有问题,但不知道提取和打印学生t斜和峰度所需的代码。
mu_norm, sig_norm = norm.fit(returns) # extract the mean and stdev of the closest normal distribution fit
print("Normal mean is {0:.8f}, stdev is {1:.8f}".format(mu_norm, sig_norm))
dx = 0.0001 # resolution of the distribution
x = np.arange(-1, 1, dx)
pdf_n = norm.pdf(x, mu_norm, sig_norm)

nu, mu_t, sig_t = t.fit(returns) # extract the mean and stdev of the closest Student-t distribution fit
nu = np.round(nu)
print("Student-t mean is {0:.8f}, stdev is {1:.8f}, dof is {2}".format(mu_t, sig_t, nu))
pdf_t = t.pdf(x, nu, mu_t, sig_t)

print('Maximum: ', returns.max())
print('Minimum: ', returns.min())
print('Norm_Skew', returns.skew())
print('Norm_Kurtosis', returns.kurtosis())
我想添加以下输出:
print('t_Skew', returns.tskew())
print('t_Kurtosis', returns.tkurtosis())回答 1
Stack Overflow用户
回答已采纳
发布于 2019-08-19 01:40:06
这是我想出来的,
import numpy as np
from scipy.stats import norm, t
import matplotlib.pyplot as plt

np.random.seed(42)
X=np.random.randn(100)
mu_n, sig_n = norm.fit(X)
# to get skew and curtosis of normal distribution
print('normal distribution, mean, variance, skew, kurtosis', norm.stats(mu_n, sig_n, moments='mvsk'))
nu, mu_t, sig_t = t.fit(X)
nu = round(nu)
# to get skew and curtosis of t distribution
print('t distribution, mean, variance, skew, kurtosis', t.stats(nu, mu_t, sig_t, moments='mvsk'))
给我
normal distribution, mean, variance, skew, kurtosis (array(-0.10384652), array(0.81652219), array(0.), array(0.))
t distribution, mean, variance, skew, kurtosis (array(-0.10382961), array(0.81653396), array(0.), array(1.46540974e-06))
密谋,
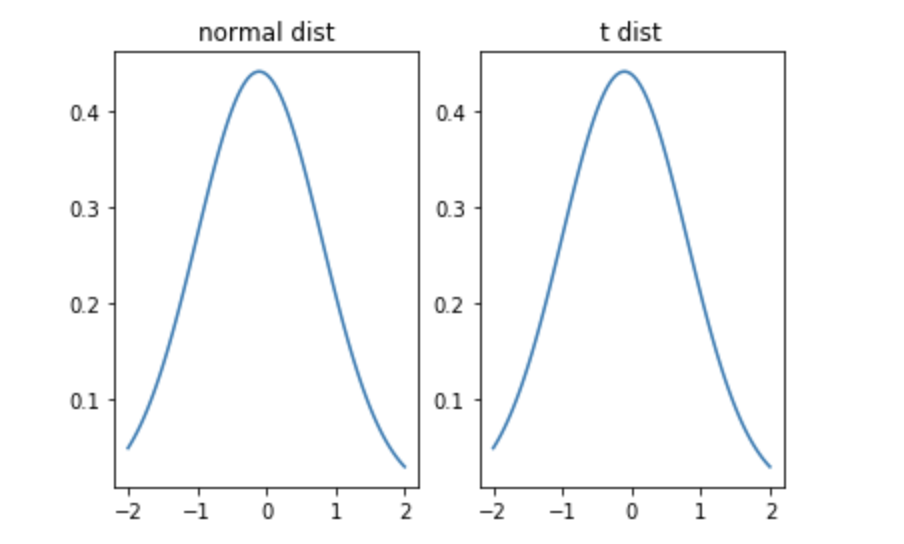
x_plot = np.linspace(-2, 2, 100)
y_plot_n = norm.pdf(x_plot, mu_n, sig_n)
y_plot_t = t.pdf(x_plot, nu, mu_t, sig_t)
f, (n_plot, t_plot) = plt.subplots(1, 2)
n_plot.set_title('normal dist')
n_plot.plot(x_plot, y_plot_n)
t_plot.plot(x_plot, y_plot_t)
t_plot.set_title('t dist')
plt.show()
页面原文内容由Stack Overflow提供。腾讯云小微IT领域专用引擎提供翻译支持
原文链接:
https://stackoverflow.com/questions/57347475
复制相关文章
相似问题
腾讯云开发者

Copyright © 2013 - 2026 Tencent Cloud. All Rights Reserved. 腾讯云 版权所有
深圳市腾讯计算机系统有限公司 ICP备案/许可证号:粤B2-20090059 ![]() 粤公网安备44030502008569号
粤公网安备44030502008569号
腾讯云计算(北京)有限责任公司 京ICP证150476号 | 京ICP备11018762号