
移除图中的二次框架
移除图中的二次框架
提问于 2019-08-01 18:10:17
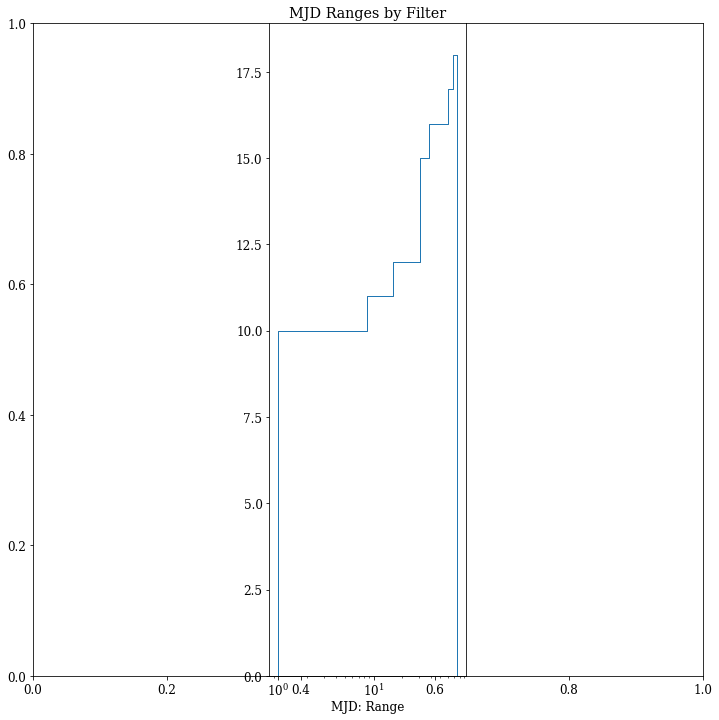
需要移除第二帧(据信是从添加图例到情节)从拟图。
首先,我已经阅读了其他关于类似问题的问答。Frameon=False或frameon=0不起作用,我最近重新下载了matplotlib。其他的答案并没有完全解决我的具体问题。我还试着摆脱了plt.legend(),它去掉了框架和传奇。于是我尝试了plt.legend(frameon=False),没有什么改变。
#Arbitrary runnable code
from getpass import getpass
import numpy as np
import pylab as plt
import matplotlib as mpl
import healpy as hp
from matplotlib.backends.backend_pdf import PdfPages


with PdfPages('KimmiesHistogram.pdf') as pdf:

    mpl.rcParams['font.family']='serif'
    mpl.rcParams['font.size']=12

    fig = plt.figure(figsize= (12,12), frameon= False)

    plt.xlabel('MJD: Range')

    plt.title("MJD Ranges by Filter")

    y= [1, 2,3,45,6,4,34,76,4,34,65,23,34,3,3,9,5,5]
    y2=[1, 2,3,45,6,4,34,76,4,34,65,23,34,3,3,9,5,5]
    ax1 = fig.add_subplot(132)
    ax1.set_xscale('log')
    ax1.set_yscale('linear')

    plt.hist([y,y2], bins=10, histtype='step', cumulative=1)

    plt.show()
谢谢!
回答 1
Stack Overflow用户
回答已采纳
发布于 2019-08-01 20:00:13
不清楚你真正的意思是什么,但我相信你看到的是三个子情节的边界。如果情况并非如此,请澄清你的问题。当我运行您的代码时,我得到以下信息:
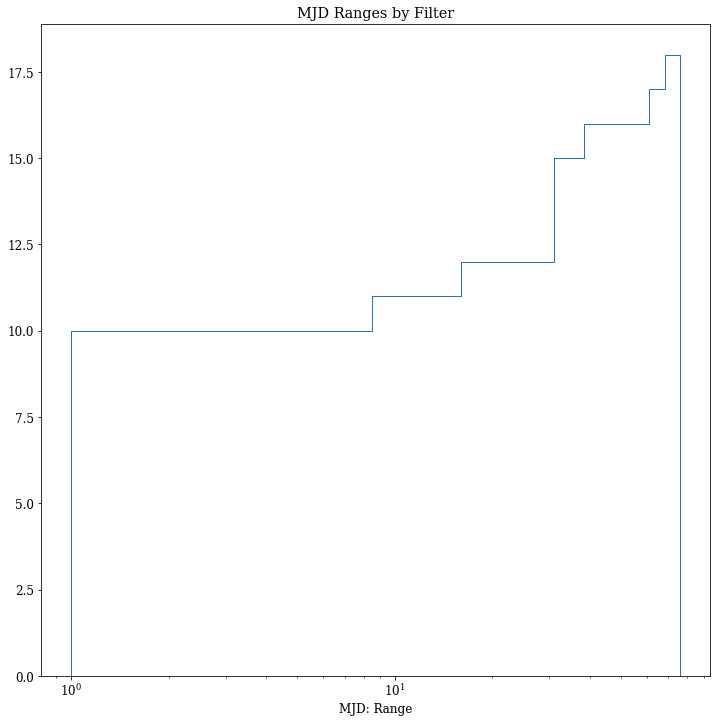
如果要删除外部框,则只需指定只添加1个子图,而不是使用ax=fig.add_subplot(111)添加3个子图的中间。这就是你的问题所在。但是老实说,您不需要在示例中添加数字轴来绘制所需的数据。
#Arbitrary runnable code
from getpass import getpass
import numpy as np
import pylab as plt
import matplotlib as mpl
from matplotlib.backends.backend_pdf import PdfPages


with PdfPages('KimmiesHistogram.pdf') as pdf:

    mpl.rcParams['font.family']='serif'
    mpl.rcParams['font.size']=12

    fig = plt.figure(figsize= (12,12), frameon= False)

    plt.xlabel('MJD: Range')

    plt.title("MJD Ranges by Filter")

    y= [1, 2,3,45,6,4,34,76,4,34,65,23,34,3,3,9,5,5]
    y2=[1, 2,3,45,6,4,34,76,4,34,65,23,34,3,3,9,5,5]
    ax1 = fig.add_subplot(111)
    ax1.set_xscale('log')
    ax1.set_yscale('linear')

    plt.hist([y,y2], bins=10, histtype='step', cumulative=1)

    plt.show()
页面原文内容由Stack Overflow提供。腾讯云小微IT领域专用引擎提供翻译支持
原文链接:
https://stackoverflow.com/questions/57314772
复制相关文章
相似问题
腾讯云开发者

Copyright © 2013 - 2026 Tencent Cloud. All Rights Reserved. 腾讯云 版权所有
深圳市腾讯计算机系统有限公司 ICP备案/许可证号:粤B2-20090059 ![]() 粤公网安备44030502008569号
粤公网安备44030502008569号
腾讯云计算(北京)有限责任公司 京ICP证150476号 | 京ICP备11018762号