
如何在具有趋势和季节性的时间序列数据中检测异常?
如何在具有趋势和季节性的时间序列数据中检测异常?
提问于 2019-07-17 06:39:53
我想在包含趋势和季节性成分的“时间序列数据”中检测异常值。我想略去那些季节性的山峰,而只考虑其他的山峰,并将它们标记为异常值。由于我是时间序列分析的新手,请帮助我处理这个时间序列问题。
编码平台使用的是Python。
尝试1:使用ARIMA模型
我对我的模型进行了训练,并预测了测试数据。然后,能够用我的实际测试数据值计算预测结果之间的差异,然后根据观察到的方差找出异常值。
Arima的实现
!pip install pyramid-arima
from pyramid.arima import auto_arima
stepwise_model = auto_arima(train_log, start_p=1, start_q=1,max_p=3, max_q=3,m=7,start_P=0, seasonal=True,d=1, D=1, trace=True,error_action='ignore', suppress_warnings=True,stepwise=True)import math
import statsmodels.api as sm
import statsmodels.tsa.api as smt
from sklearn.metrics import mean_squared_error将数据拆分为训练和测试集
train, test = actual_vals[0:-70], actual_vals[-70:]对数变换
train_log, test_log = np.log10(train), np.log10(test)转换为列表
history = [x for x in train_log]
predictions = list()
predict_log=list()
逐步ARIMA模型的拟合
for t in range(len(test_log)):
stepwise_model.fit(history)
    output = stepwise_model.predict(n_periods=1)
    predict_log.append(output[0])
    yhat = 10**output[0]
    predictions.append(yhat)
    obs = test_log[t]
    history.append(obs)
标绘
figsize=(12, 7)
plt.figure(figsize=figsize)
pyplot.plot(test,label='Actuals')
pyplot.plot(predictions, color='red',label='Predicted')
pyplot.legend(loc='upper right')
pyplot.show()
但我只能在测试数据中检测到异常值。实际上,我必须检测整个时间序列数据的异常值,包括我所拥有的火车数据。
尝试2:使用季节分解
我已经使用下面的代码将原始数据分割成季节、趋势、残差,在下面的图像中可以看到。
from statsmodels.tsa.seasonal import seasonal_decompose

decomposed = seasonal_decompose()
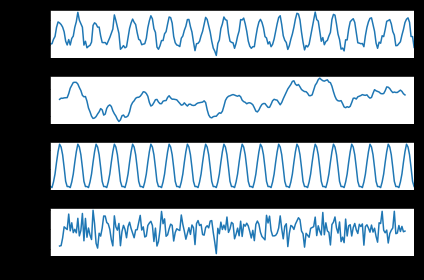
然后利用残差数据,从季节和趋势成分去除后,利用盒形图来找出异常值。这有道理吗?
还是有其他简单或更好的方法可供选择?
回答 1
Stack Overflow用户
发布于 2019-08-28 14:07:13
您可以:
- 在
"Attempt 2 : Using Seasonal Decomposition"的第4张图(残差图)中,试着检查极值点,这可能会导致季节序列中的一些异常。 - 监督(如果你有一些有标签的数据):做一些分类。
- 无监督:尝试预测下一个值,并创建一个置信区间,以检查预测是否位于其中。
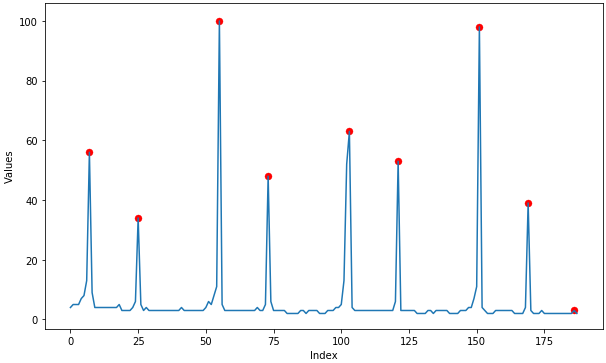
- 您可以尝试计算数据的相对极值。例如,使用argrel极值(如此处所示):
from scipy.signal import argrelextrema
x = np.array([2, 1, 2, 3, 2, 0, 1, 0])
argrelextrema(x, np.greater)
产出:
(数组(3,6),)
一些随机数据(我对上述论证的实现):
页面原文内容由Stack Overflow提供。腾讯云小微IT领域专用引擎提供翻译支持
原文链接:
https://stackoverflow.com/questions/57069892
复制相关文章
相似问题
腾讯云开发者

Copyright © 2013 - 2026 Tencent Cloud. All Rights Reserved. 腾讯云 版权所有
深圳市腾讯计算机系统有限公司 ICP备案/许可证号:粤B2-20090059 ![]() 粤公网安备44030502008569号
粤公网安备44030502008569号
腾讯云计算(北京)有限责任公司 京ICP证150476号 | 京ICP备11018762号