
如何将用ggplot2生成的图形与用cowplot::plot_grid生成的图形相结合
如何将用ggplot2生成的图形与用cowplot::plot_grid生成的图形相结合
提问于 2019-07-16 12:59:36
最初,我无法完全绘制它,这意味着我无法找到捕获绘图对象并将其提供给cowplot::plot_grid的方法。现在,我找到了一个解决办法,可以将图形图的图像保存为png,并使用cowplot::draw_image读取它。有更简单的方法吗?同时,为了获得较好的分辨率和尺寸,避免边缘裁剪,很难设置png的参数。我还需要对图进行一些调整,例如,具有精确连接权值的自循环箭头和有向箭头应该是可能的。
在下面,有两个选项及其各自的结果。
library(ggplot2); library(cowplot); library(igraph)
graph_1 <- sample_gnm(10, 25, directed = T, loops = T)
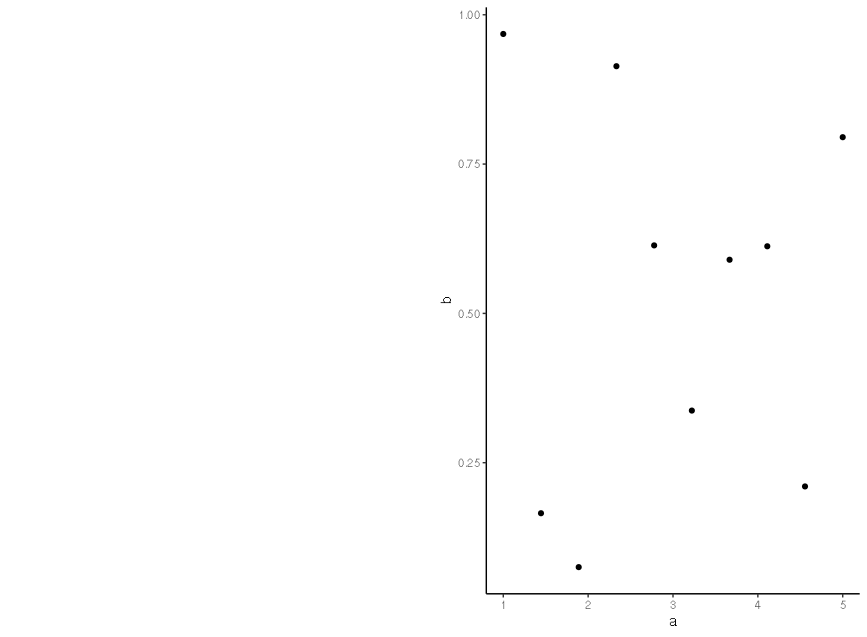
gg_test <- ggplot(data.frame("a" = seq(1, 5, length.out = 10), "b" = runif(10)), aes(x=a, y=b)) + geom_point() + theme_classic()选项1-直接
# option 1 - empty graph
cowplot::plot_grid(plot(graph_1), gg_test)
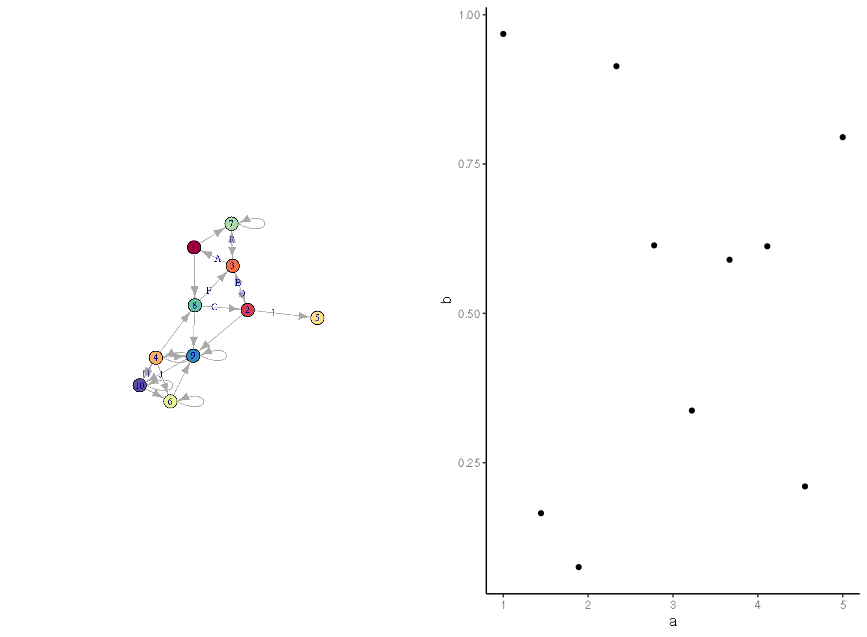
选项2-提交
# option 2 - working but horrible code and difficult setting of the resolution/size (r-base not the best)
png("to_delete_for_import.png", res = 150, height = 800, width = 1100)
plot(graph_1, edge.label = LETTERS[1:10], vertex.color = RColorBrewer::brewer.pal(10, "Spectral"))
dev.off()
graph_1_cwpl <- ggdraw() + draw_image("to_delete_for_import.png")
file.remove("to_delete_for_import.png")
cowplot::plot_grid(graph_1_cwpl, gg_test)
回答 1
Stack Overflow用户
发布于 2019-07-16 15:28:35
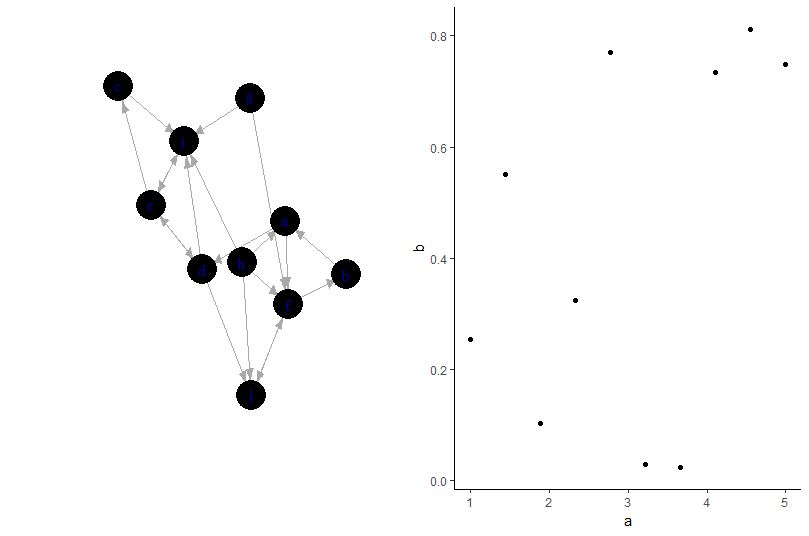
最近我也遇到了同样的问题,并发现以下解决方案是有帮助的。第一种方法类似于用户@一月已经评论过的内容:
library(ggplotify)
E(graph_1)$label <- ""
plot_grid(base2grob(~plot(graph_1)),
          gg_test)
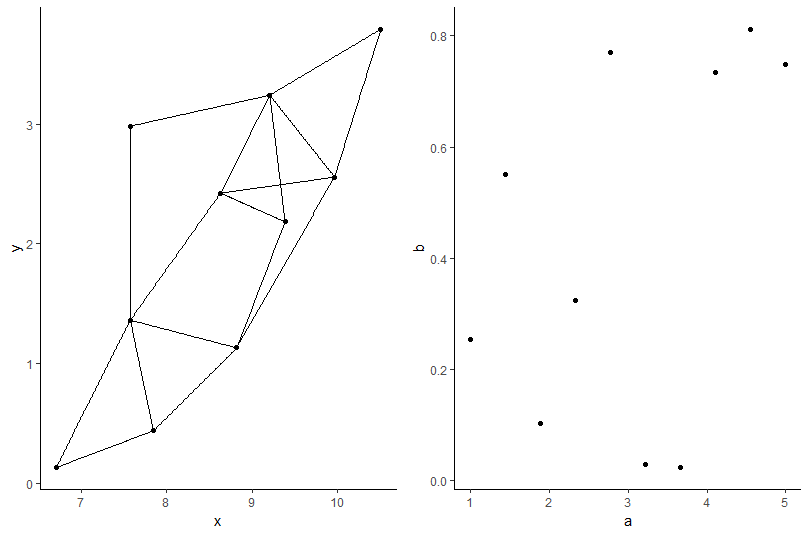
下面是使用ggraph的第二种方法
library(ggraph)
ggtest2 <- ggraph(graph_1) +
          geom_node_point() +
          geom_edge_link() +
          theme_classic()

plot_grid(ggtest2, gg_test)
页面原文内容由Stack Overflow提供。腾讯云小微IT领域专用引擎提供翻译支持
原文链接:
https://stackoverflow.com/questions/57057851
复制相关文章
相似问题
腾讯云开发者

Copyright © 2013 - 2026 Tencent Cloud. All Rights Reserved. 腾讯云 版权所有
深圳市腾讯计算机系统有限公司 ICP备案/许可证号:粤B2-20090059 ![]() 粤公网安备44030502008569号
粤公网安备44030502008569号
腾讯云计算(北京)有限责任公司 京ICP证150476号 | 京ICP备11018762号