
如何在Chrome分析/性能选项卡中读取评估脚本时间
如何在Chrome分析/性能选项卡中读取评估脚本时间
提问于 2019-07-04 21:28:29
有人告诉我,我的脚本阻塞了我客户网站上的主线程。
它被标记为<script async...>,所以它不应该是一个网络块。
我运行了Chrome分析器,我真的不明白我在看什么,尽管我在谷歌上搜索解释。
下面是这个脚本的截图:
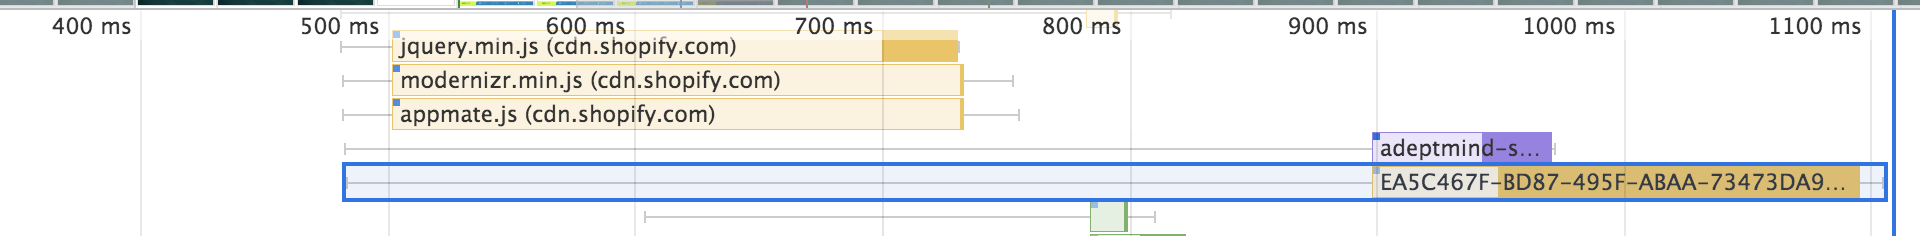
我不明白整个蓝色块的哪一部分是“线程阻塞部分”
下面是关联的Bottom-Up表:
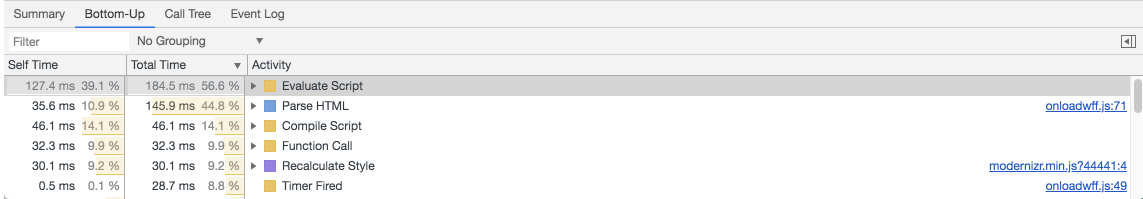
从第一张图片,“细线”的跨度从大约500毫秒到大约900毫秒,也就是大约400毫秒的时间,但在自下而上的表格中,它表示“评估脚本”的总时间是184.5毫秒。
那么,我是否可以假设脚本的“阻塞”时间应该从自下而上的表中提取,最终达到184.5ms?
回答 1
Stack Overflow用户
回答已采纳
发布于 2020-06-17 17:57:48
- 在第一个屏幕截图中,我们将看到网络部分。您可以阅读如何理解它,这里。 简言之:
- The left line is everything up to the `Connection Start` group of events, inclusive. In other words, it's everything before `Request Sent`, exclusive.
- The light portion of the bar is `Request Sent` and `Waiting (TTFB)`.
- The dark portion of the bar is `Content Download`.
- The right line is essentially time spent **waiting for the main thread**
所以这不是执行时间的问题。
- 我自己还不完全理解网络部分的
Bottom-Up选项卡意味着什么.也许吧它甚至没有与网络请求的直接连接:Bottom-Up选项卡仅在录制的选定部分期间显示活动。
并不一定意味着。
- 但不管怎样,这可能不是你要找的东西。看一看 main 部分,在网络请求结束后,当等待主线程的最终结束时,它是免费的,可以执行脚本,您可能会看到一个很长的条--这时脚本正在阻塞主线程。 看屏幕截图
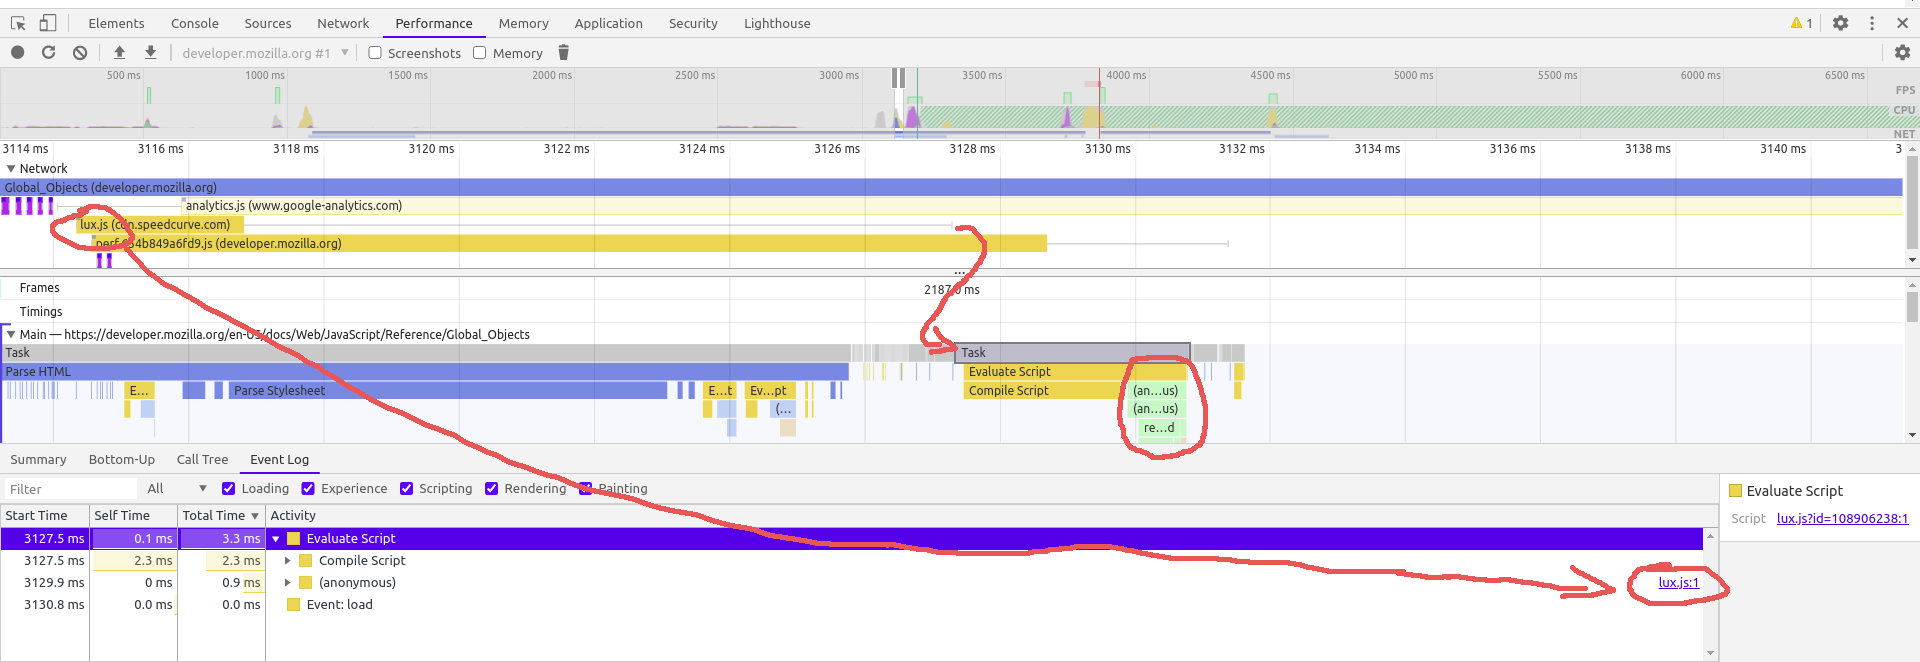
- First `lux.js` is loaded (from the cache in this particular case).
- Then it waits for the main thread (from 3117ms until 3128ms).
- Then a `Task` starts (it is selected and pointed to with the small arrow, the big arrow points to the fact that `lux.js` is indeed begins its execution)
- Some time is spent on `Compile Script`
- And only then you can see a flame chart of script execution (in red circle)您可以在同一页这里上阅读更多有关这方面的内容。
此外,还可以在这里和以后的文章中找到一些关于性能监视器使用优化的额外信息和见解。
页面原文内容由Stack Overflow提供。腾讯云小微IT领域专用引擎提供翻译支持
原文链接:
https://stackoverflow.com/questions/56894370
复制相关文章
相似问题
腾讯云开发者

Copyright © 2013 - 2026 Tencent Cloud. All Rights Reserved. 腾讯云 版权所有
深圳市腾讯计算机系统有限公司 ICP备案/许可证号:粤B2-20090059 ![]() 粤公网安备44030502008569号
粤公网安备44030502008569号
腾讯云计算(北京)有限责任公司 京ICP证150476号 | 京ICP备11018762号