
基于公式的净现值计算:卡住创造序列
我试着复制一些公式
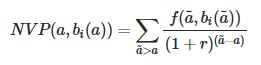
在哪里;
- R是贴现率,
- A是年龄
- bi(a)是decile_INCOME
- f(a,bi(a))是年龄和十分之一的平均收入。
我拥有的数据如下:
# A tibble: 150 x 3
     AGE decile_INCOME     mean
   <dbl>         <int>    <dbl>
 1    81             9  347816.
 2    86             2   22700.
 3    60             3   39750.
 4    91             9 3459166.
 5    24             9   54927.
 6    64             4   43966.
 7    65             3   23289.
 8    37            10  360649.
 9    69             4   67781.
10    38             2   31198.
因此,对于每个年龄和decile_Income,我想要计算的净现值,类似于下面(对于一个小样本的数据和年龄= 25)。
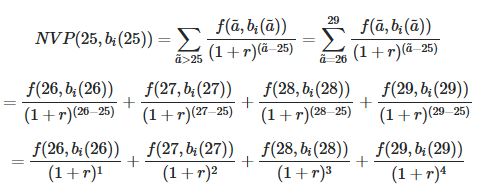
a_bar是索引,所以使用上面的例子,a= 25,然后a_bar > a,因此a_bar∈{26,27,28,29.}
我的尝试:(我一直试图为“a_bar”创建一组序列)
rate = 0.05
npvs <- df %>%
  mutate(a_tilde = 34567890, # stuck here
         discount = 1 / (1 + rate) ^ (a_tilde - AGE),
         NPVs = mean * discount)
编辑:完整数据:
因为carácter的限制而不得不删除数据。
编辑:
观察以下意见:
在代码中,我们是group_by decile_INCOME & AGE_REF,但是我们应该group_by decile_INCOME & AGE吗?
   AGE decile_INCOME mean_AGEbin_decileInc households_per_AGE_decile REF_AGE disc_rate disc_mean
1   20             1              4092.739                        12      18 0.9070295  3712.235
2   20             1              4092.739                        12      19 0.9523810  3897.847
3   20             1              4092.739                        12      20 1.0000000  4092.739
4   20             2              5392.289                        12      18 0.9070295  4890.965
5   20             2              5392.289                        12      19 0.9523810  5135.513
6   20             2              5392.289                        12      20 1.0000000  5392.289
7   20             3              6826.857                        12      18 0.9070295  6192.161
8   20             3              6826.857                        12      19 0.9523810  6501.769
9   20             3              6826.857                        12      20 1.0000000  6826.857
10  20             4              9029.341                        12      18 0.9070295  8189.879
11  20             4              9029.341                        12      19 0.9523810  8599.373
12  20             4              9029.341                        12      20 1.0000000  9029.341
13  20             5             13333.046                        12      18 0.9070295 12093.466
14  20             5             13333.046                        12      19 0.9523810 12698.139
15  20             5             13333.046                        12      20 1.0000000 13333.046
16  20             6             19746.410                        12      18 0.9070295 17910.576
17  20             6             19746.410                        12      19 0.9523810 18806.105
18  20             6             19746.410                        12      20 1.0000000 19746.410
19  20             7             26497.320                        12      18 0.9070295 24033.850
20  20             7             26497.320                        12      19 0.9523810 25235.542
21  20             7             26497.320                        12      20 1.0000000 26497.320
22  20             8             32910.684                        12      18 0.9070295 29850.960
23  20             8             32910.684                        12      19 0.9523810 31343.508
24  20             8             32910.684                        12      20 1.0000000 32910.684
25  20             9             39661.593                        12      18 0.9070295 35974.234
26  20             9             39661.593                        12      19 0.9523810 37772.946
27  20             9             39661.593                        12      20 1.0000000 39661.593
28  20            10             60083.094                        12      18 0.9070295 54497.137
29  20            10             60083.094                        12      19 0.9523810 57221.994
30  20            10             60083.094                        12      20 1.0000000 60083.094
当我这样做的时候,我得到了一个情节,看起来是:
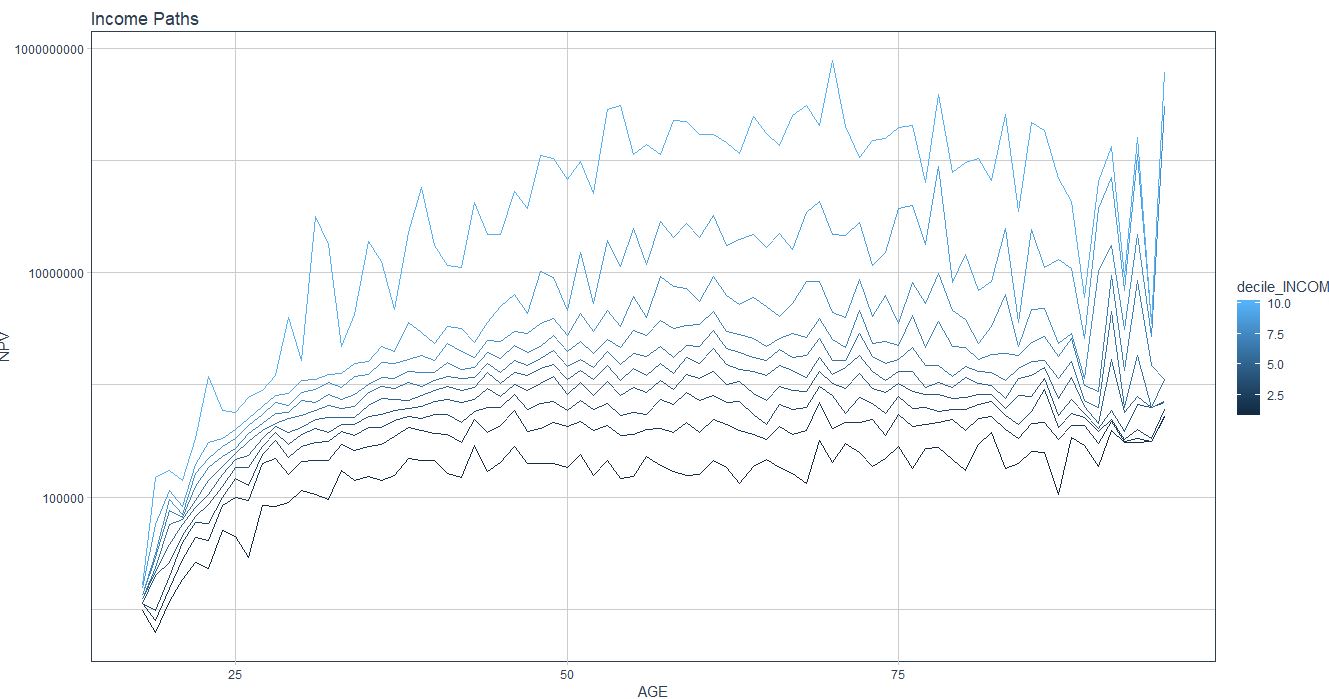
看上去不像你的…那么光滑。
回答 2
Stack Overflow用户
发布于 2019-07-03 17:27:59
这是18岁的npv:
library(dplyr)
rate = 0.05
df %>%
  arrange(decile_INCOME, AGE) %>%
  group_by(decile_INCOME) %>%
  mutate(disc_rate = 1 / (1+rate) ^ (AGE - min(AGE)),
         disc_mean = mean * disc_rate) %>%
  # try View()  at this stage to review how the discount is applied
  summarize(npv = sum(disc_mean))

# A tibble: 10 x 2
   decile_INCOME       npv
           <int>     <dbl>
 1             1   196051.
 2             2   381107.
 3             3   539085.
 4             4   717242.
 5             5   925751.
 6             6  1185537.
 7             7  1582346.
 8             8  2796287.
 9             9  6955914.
10            10 51016943.
若要将折扣退回到25岁,请过滤掉较早的年龄,并执行相同的操作:
df %>%
  filter(AGE >= 25) %>%
  arrange(decile_INCOME, AGE) %>%
  group_by(decile_INCOME) %>%
  mutate(disc_rate = 1 / (1+rate) ^ (AGE - min(AGE)),
         disc_mean = mean * disc_rate) %>%
  summarize(npv = sum(disc_mean))

# A tibble: 10 x 2
   decile_INCOME       npv
           <int>     <dbl>
 1             1   226399.
 2             2   465403.
 3             3   670195.
 4             4   897065.
 5             5  1165181.
 6             6  1504068.
 7             7  2023148.
 8             8  3694092.
 9             9  9479113.
10            10 71109533.
或者,为了获得所有年龄的npvs,我们可以为每个可能的参考年龄复制每一行,根据参考年龄计算折扣,然后根据十分之一和参考年龄进行汇总:
df %>%
uncount(max(AGE), .id = "REF_AGE") %>%
arrange(REF_AGE, decile_INCOME, AGE) %>%
mutate(disc_rate = 1 / (1+rate) ^ (AGE - REF_AGE),
disc_mean = mean * disc_rate) %>%
group_by(decile_INCOME, REF_AGE) %>%
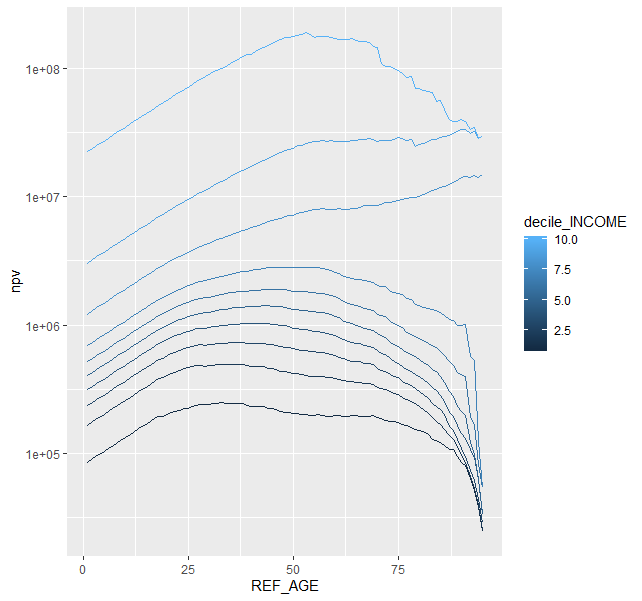
summarize(npv = sum(disc_mean))以图表形式显示:
  [chain above...] %>%
  ggplot(aes(REF_AGE, npv, color = decile_INCOME, group = decile_INCOME)) +
  geom_line() +
  scale_y_log10()
Stack Overflow用户
发布于 2019-07-03 16:46:13
为了理解,在您的数据中,您有多个相同年龄的观测:
    AGE decile_INCOME         mean
17   19             2     4033.668
73   19            10    76454.049
101  19             3     5019.783
123  21             5    15358.319
34   22             2     9486.804
35   22             8    35868.648
98   22             3    13057.680
在给定的年龄公式中输入的f值是多少:这些值的平均值?例如,f(22,b_i(22))是什么?你能创建一个虚拟变量D,对所有年龄小于a的变量是0,然后通过D*平均值而不是平均值吗?那么你就不必对不等式约束之和.
https://stackoverflow.com/questions/56873420
复制相似问题
腾讯云开发者

Copyright © 2013 - 2026 Tencent Cloud. All Rights Reserved. 腾讯云 版权所有
深圳市腾讯计算机系统有限公司 ICP备案/许可证号:粤B2-20090059 ![]() 粤公网安备44030502008569号
粤公网安备44030502008569号
腾讯云计算(北京)有限责任公司 京ICP证150476号 | 京ICP备11018762号