
如何验证LeakCanary是否正常工作--在日志记录中看不到LeakCanary
我有一个遗留的项目
- 在Java中
- 还没有迁移到AndroidX
最近,它正在生产神秘的OutOfMemoryException。
我们使用以下方法来找出根本原因
debugImplementation 'com.squareup.leakcanary:leakcanary-android:1.6.3'
implementation 'com.squareup.leakcanary:leakcanary-android:1.6.3'我们还在refWatcher = LeakCanary.install(this);的Application's onCreate中将其命名为onCreate。
但是,在完成上述所有操作并在仿真程序中运行之后,我们使用
D/LeakCanary
但是,我们没有看到任何关于LeakCanary的日志。
我们遗漏了什么吗?
但是,我们看到0输出。
还有什么是我们遗漏的吗?
回答 2
Stack Overflow用户
发布于 2019-06-25 09:15:04
你不需要添加
implementation 'com.squareup.leakcanary:leakcanary-android:1.6.3'泄漏金丝雀所需的唯一依赖是:
debugImplementation 'com.squareup.leakcanary:leakcanary-android:1.6.3'之后,在Application onCreate方法中添加以下代码:
@Override
public void onCreate() {
    super.onCreate();

    if (LeakCanary.isInAnalyzerProcess(this)) {
        // This process is dedicated to LeakCanary for heap analysis.
        // You should not init your app in this process.
        return;
    }
    LeakCanary.install(this);

    // rest of your init code
}
之后将安装一个带有以下图标的应用程序:

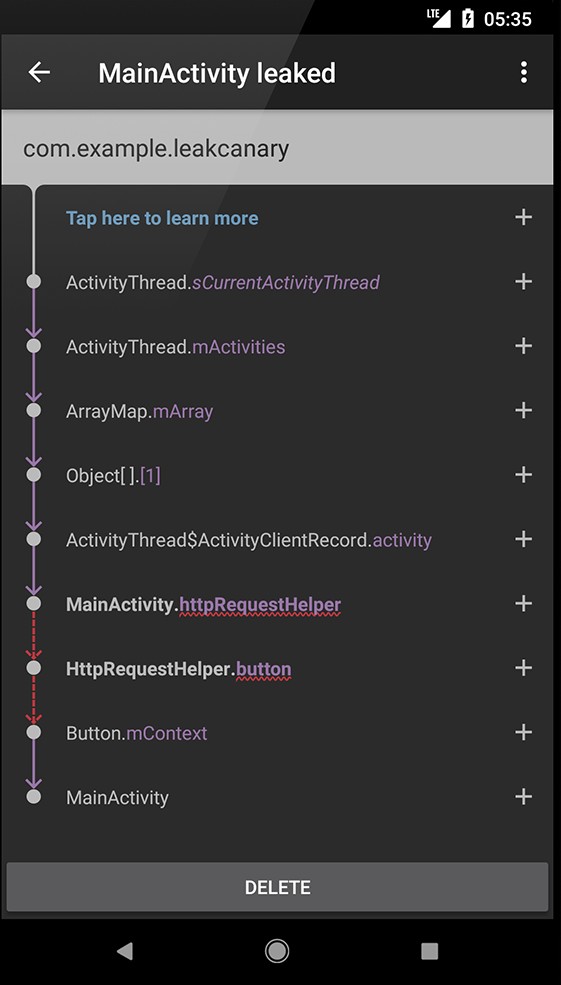
现在你只需要运行你的应用程序。当内存泄漏发生时,将显示一个对话框,显示泄漏被检测到。
当您打开具有上述图标的应用程序时,您将看到内存泄漏和泄漏跟踪:
Stack Overflow用户
发布于 2020-08-04 12:21:44
LeakCanary库现在升级到2.x版本。
要使用LeakCanary,请将泄漏的金丝雀-android依赖项添加到应用程序的build.gradle文件中:
dependencies {
  // debugImplementation because LeakCanary should only run in debug builds.
  debugImplementation 'com.squareup.leakcanary:leakcanary-android:2.4'
}
就是这样,根本不需要修改代码!
通过对Logcat中的LeakCanary标记进行筛选,确认LeakCanary在启动时运行:
D LeakCanary: LeakCanary is running and ready to detect leaks来源:started/
https://stackoverflow.com/questions/56726120
复制相似问题
腾讯云开发者

Copyright © 2013 - 2026 Tencent Cloud. All Rights Reserved. 腾讯云 版权所有
深圳市腾讯计算机系统有限公司 ICP备案/许可证号:粤B2-20090059 ![]() 粤公网安备44030502008569号
粤公网安备44030502008569号
腾讯云计算(北京)有限责任公司 京ICP证150476号 | 京ICP备11018762号