
在调整后的生存曲线中定制直线类型(survminer,ggplot2)
我试图画出一条调整后的生存曲线,但很难按组改变线条类型。我能够使用典型的ggplot2语言定制绘图的其他方面,但我遇到了更改行类型的问题。
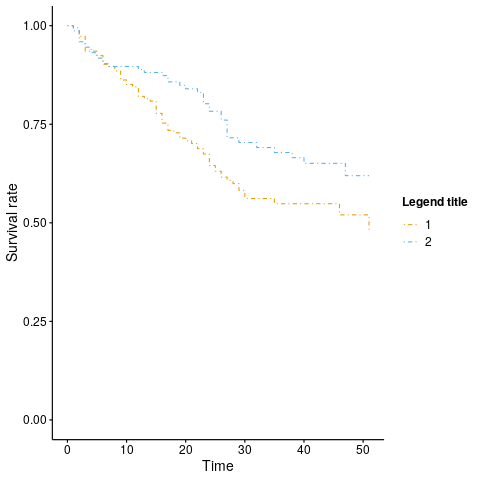
示例:
library(survival)
library(survminer)

fit2 <- coxph( Surv(stop, event) ~ size + strata(rx), data = bladder )

ggadjustedcurves(fit2,
                 variable = "rx",
                 data = bladder,
                 method = "average",
                 palette = c("#E69F00", "#56B4E9"),
                 size = 1.3,
                 legend = "right",
                 legend.title = expression(bold("Legend title")),
                 xlab = "Time",
                 font.legend = 12) +
  theme(legend.text.align = 0.5)
我试过加入:
geom_line( aes( linetype = c(1, 2) )
add.params = list(linetype = c(1, 2))
然后就
linetype = c(1, 2)但似乎什么都起不到作用。
回答 1
Stack Overflow用户
发布于 2019-06-16 19:44:37
首先,您需要查看代码。
ggadjustedcurves看来,ggadjustedcurves将其所有参数传递给依赖于“方法”参数的助手函数,在本例中为“平均”,因此现在来看(隐藏)函数:
getAnywhere( ggadjustedcurves.average )请注意,除了在“主函数”中定义的少数参数之外,没有接受附加参数的规定,即不使用R的省略机制或其他可能的aes-参数的规格--除了大小。(它也不使用geom_line。)因此,您需要同时更改主函数和助手函数,以接受"linetype“参数。在这里,我将展示如何修改助手函数(尽管这也需要对ggadjustedcurves函数进行修改,如果您想让它变得完全通用的话,可能还需要修改其馀的辅助函数):
assignInNamespace('ggadjustedcurves.average',

  function (data, fit, variable, size = 1, ..., linetype=linetype)
    {
    time <- surv <- NULL
    lev <- sort(unique(data[, variable]))
    pred <- survexp(as.formula(paste("~", variable)), data = data,
                    ratetable = fit)
    curve <- data.frame(time = rep(c(0, pred$time), length(lev)),
                        variable = factor(rep(lev, each = 1 + length(pred$time))),
                        surv = c(rbind(1, pred$surv)))
    ggplot(curve, aes(x = time, y = surv, color = variable)) +
        geom_step(size = size, ..., linetype=linetype)  # not geom_line
    },
   pos="package:survminer")
如果对"geom_segment线型“进行如此搜索,您会发现geom_segment (这是geon_step所使用的)的构造方式使得很容易给出短向量来修改步骤函数的”连续“长度。见ggplot error using linetype and group aesthetics。这意味着,如果需要不同的线条类型,则需要使用for-loop或lapply来构建单独的“步进曲线”。
https://stackoverflow.com/questions/56582928
复制相似问题
腾讯云开发者

Copyright © 2013 - 2026 Tencent Cloud. All Rights Reserved. 腾讯云 版权所有
深圳市腾讯计算机系统有限公司 ICP备案/许可证号:粤B2-20090059 ![]() 粤公网安备44030502008569号
粤公网安备44030502008569号
腾讯云计算(北京)有限责任公司 京ICP证150476号 | 京ICP备11018762号