
在同一地块上重新排序3 geom_ same的图例标签
在同一地块上重新排序3 geom_ same的图例标签
提问于 2019-06-07 21:45:04
在过去的几个小时里,我一直在寻找解决方案,但却找不到类似的解决方案。我试图简单地重新排列图片集的图片集,我的数据栏有3列作为单独的行,它们都是与第4列相关的。为了简化,我创建了一个非常小的数据框架:
x <- data.frame("Score" = c(2,4,7,3,2,1,5,6,4,3,1,3), "var1" = c(3,4,3,6,7,6,4,3,5,7,7,3), "var2" = c(3,5,6,5,2,3,7,8,4,3,6,1))
x

ggplot(data = x)+
  geom_smooth(mapping = aes(x = Score, y=var1 , linetype = "var1"), color = "black", se = FALSE)+
  geom_smooth(mapping = aes(x = Score, y=var2, linetype = "var2"), colour = "black", se = FALSE)+
  scale_x_discrete()+
  scale_y_discrete()
在这个例子中,我只想把"y在13-18岁“移到另一个标签下面。澄清一下,这个地块上的两行都是相同的刻度(y)。
非常感谢您的帮助,谢谢!
编辑
OP在comment中发布的新代码。
x <- data.frame("Score" = c(2,4,7,3,2,1,5,6,4,3,1,3),
                "Age_6to10" = c(3,4,3,6,7,6,4,3,5,7,7,3),
                "Age_13to18" = c(3,5,6,5,2,3,7,8,4,3,6,1))

x

ggplot(data = x) +
  geom_smooth(mapping = aes(x = Score, y= Age_6to10 , linetype = "y at Age 6-10"), color = "black", se = FALSE) +
  geom_smooth(mapping = aes(x = Score, y=Age_13to18, linetype = "y at Age 13-18"), colour = "black", se = FALSE)+
  scale_x_discrete() +
scale_y_discrete(name= "y") 回答 2
Stack Overflow用户
发布于 2019-06-07 22:00:29
ggplot的最佳实践是重塑您的数据,以便将您想要在图例中显示并映射到美学(例如,线型)的每一个特征都放入列中。在本例中,我使用tidyr::gather将两个年龄组的值拉到一列中,将哪个年龄组的规范提取到另一列中。
ggplot(data = tidyr::gather(x, group, value, -Score)) +
  geom_smooth(mapping = aes(x = Score, y= value ,
                            linetype = forcats::fct_rev(group)),
                            color = "black", se = FALSE) +
  scale_x_discrete() +
  scale_y_discrete(name= "y") +
  scale_linetype_discrete(name = "Age group")
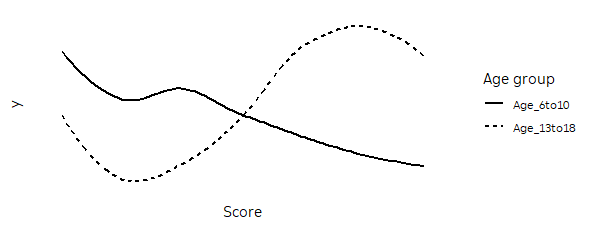
以下是重塑后的数据的外观:
> tidyr::gather(x, group, value, -Score)
   Score      group value
1      2  Age_6to10     3
2      4  Age_6to10     4
3      7  Age_6to10     3
4      3  Age_6to10     6
5      2  Age_6to10     7
6      1  Age_6to10     6
7      5  Age_6to10     4
8      6  Age_6to10     3
9      4  Age_6to10     5
10     3  Age_6to10     7
11     1  Age_6to10     7
12     3  Age_6to10     3
13     2 Age_13to18     3
14     4 Age_13to18     5
15     7 Age_13to18     6
16     3 Age_13to18     5
17     2 Age_13to18     2
18     1 Age_13to18     3
19     5 Age_13to18     7
20     6 Age_13to18     8
21     4 Age_13to18     4
22     3 Age_13to18     3
23     1 Age_13to18     6
24 3 Age_13to18 1Stack Overflow用户
发布于 2019-06-07 22:01:53
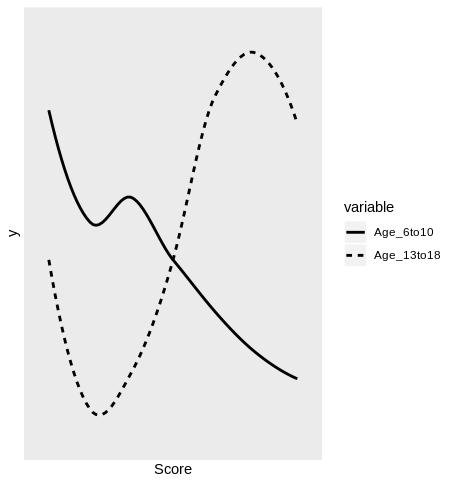
最好将数据从宽到长重新格式化,然后绘制它。
标签是按照请求的顺序排列的,因为在重新格式化variable后,它是一个因素,其级别由正确的顺序决定。请参见下面str的输出。
xlong <- reshape2::melt(x, id.vars = "Score")
str(xlong)
#'data.frame':  24 obs. of  3 variables:
# $ Score   : num  2 4 7 3 2 1 5 6 4 3 ...
# $ variable: Factor w/ 2 levels "Age_6to10","Age_13to18": 1 1 1 1 1 1 1 1 1 1 ...
# $ value   : num  3 4 3 6 7 6 4 3 5 7 ...


ggplot(data = xlong,
       mapping = aes(x = Score, y = value, linetype = variable)) +
  geom_smooth(color = "black", se = FALSE) +
  scale_x_discrete() +
  scale_y_discrete(name= "y")
页面原文内容由Stack Overflow提供。腾讯云小微IT领域专用引擎提供翻译支持
原文链接:
https://stackoverflow.com/questions/56501546
复制相关文章
相似问题
腾讯云开发者

Copyright © 2013 - 2026 Tencent Cloud. All Rights Reserved. 腾讯云 版权所有
深圳市腾讯计算机系统有限公司 ICP备案/许可证号:粤B2-20090059  粤公网安备44030502008569号
腾讯云计算(北京)有限责任公司 京ICP证150476号 | 京ICP备11018762号