
多幅3x4中的等帧大小
多幅3x4中的等帧大小
提问于 2019-05-30 16:10:45
我有下面的多重图
set encoding iso_8859_1


set xtics font "Helvetica,16"
set ytics font "Helvetica,16"

set terminal postscript eps enhanced color size 12in,6in
set grid

set key box vertical width 2 height 0.75 maxcols 1 #spacing 1
load "../estilos.txt"

# TMARGIN = "set tmargin at screen 0.90; set bmargin at screen 0.55"
# BMARGIN = "set tmargin at screen 0.55; set bmargin at screen 0.20"
# LMARGIN = "set lmargin at screen 0.15; set rmargin at screen 0.55"
# RMARGIN = "set lmargin at screen 0.55; set rmargin at screen 0.95"
############################################################################################
set output "_Mult_16R_4Chk_mp.eps"

set title "Minimum number of contention intervals, {/Symbol D}=1" font "Helvetica,17"

set multiplot layout 3,4 columnsfirst
set xlabel ""
set ylabel "T [s]" font "Helvetica,19"
set key top left font "Helvetica,16"
# @TMARGIN @LMARGIN
plot [0:40][0:140] "contention_1/sys-time-4-16-80-15-2.txt" u ($1/60):2 every 2  ls 20   ps 0.35  title "MSL=80%"

set title ""
set key top left font "Helvetica,16"
set ylabel "Queue length [batches]" font "Helvetica,19"
# @BMARGIN; @LMARGIN
plot [0:40][0:70] "contention_1/queue-length-4-16-50-15-1.txt"  using ($1/60):2 every 2 with lines  ls 20    lw 1.5   title "MSL=50%" ,\
                  "contention_1/queue-length-4-16-80-15-2.txt" using  ($1/60):2  every 2 with lines  ls 2200  lw 1.5   title "MSL=80%" ,\
                  "contention_1/queue-length-4-16-98-15-3.txt" using  ($1/60):2  every 2 with lines  ls 5550  lw 1.5   title "MSL=98%"

set key bottom right font "Helvetica,16"
set ylabel "Inventory ratio, {/Symbol g}" font "Helvetica,19"
set xlabel "Operation time [minutes]" font "Helvetica,19"

# @BMARGIN; @LMARGIN
plot [0:40][0:1] "contention_1/known-ratio-4-16-50-15-1.txt"  using ($1/60):2 every 2 w linespoints  ls 20   ps 0.75 lw 1.5    title "MSL=50%" ,\
                 "contention_1/known-ratio-4-16-80-15-2.txt" using  ($1/60):2  every 2 w linespoints  ls 2200 ps 0.75 lw 1.5       title "MSL=80%" ,\
                 "contention_1/known-ratio-4-16-98-15-3.txt" using  ($1/60):2  every 2 w linespoints  ls 5550 ps 0.75 lw 1.5         title "MSL=98%"

############################################################################################

set title "Minimum number of contention intervals, {/Symbol D}=100" font "Helvetica,17"

set xlabel ""
set ylabel ""
set key top left font "Helvetica,16"
plot [0:40][0:140] "contention_100/sys-time-4-16-80-15-2.txt" u ($1/60):2 every 2  ls 20   ps 0.35  title "MSL=80%"

set title ""
set key top left font "Helvetica,16"
plot [0:40][0:70] "contention_100/queue-length-4-16-50-15-1.txt"  using ($1/60):2 every 2 with lines  ls 20    lw 1.5   title "MSL=50%" ,\
                  "contention_100/queue-length-4-16-80-15-2.txt" using  ($1/60):2  every 2 with lines  ls 2200  lw 1.5   title "MSL=80%" ,\
                  "contention_100/queue-length-4-16-98-15-3.txt" using  ($1/60):2  every 2 with lines  ls 5550  lw 1.5   title "MSL=98%"

set key bottom right font "Helvetica,16"
set xlabel "Operation time [minutes]" font "Helvetica,19"


plot [0:40][0:1] "contention_100/known-ratio-4-16-50-15-1.txt"  using ($1/60):2 every 2 w linespoints  ls 20   ps 0.75 lw 1.5    title "MSL=50%" ,\
                 "contention_100/known-ratio-4-16-80-15-2.txt" using  ($1/60):2  every 2 w linespoints  ls 2200 ps 0.75 lw 1.5       title "MSL=80%" ,\
                 "contention_100/known-ratio-4-16-98-15-3.txt" using  ($1/60):2  every 2 w linespoints  ls 5550 ps 0.75 lw 1.5         title "MSL=98%"

############################################################################################

set title "Minimum number of contention intervals, {/Symbol D}=200" font "Helvetica,17"

set xlabel ""
set ylabel ""
set key top left font "Helvetica,16"
plot [0:40][0:140] "contention_200/sys-time-4-16-80-15-2.txt" u ($1/60):2 every 2  ls 20   ps 0.35  title "MSL=80%"

set title ""
set key top left font "Helvetica,16"
plot [0:40][0:70] "contention_200/queue-length-4-16-50-15-1.txt"  using ($1/60):2 every 2 with lines  ls 20    lw 1.5   title "MSL=50%" ,\
                  "contention_200/queue-length-4-16-80-15-2.txt" using  ($1/60):2  every 2 with lines  ls 2200  lw 1.5   title "MSL=80%" ,\
                  "contention_200/queue-length-4-16-98-15-3.txt" using  ($1/60):2  every 2 with lines  ls 5550  lw 1.5   title "MSL=98%"

set key bottom right font "Helvetica,16"
set xlabel "Operation time [minutes]" font "Helvetica,19"


plot [0:40][0:1] "contention_200/known-ratio-4-16-50-15-1.txt"  using ($1/60):2 every 2 w linespoints  ls 20   ps 0.75 lw 1.5    title "MSL=50%" ,\
                 "contention_200/known-ratio-4-16-80-15-2.txt" using  ($1/60):2  every 2 w linespoints  ls 2200 ps 0.75 lw 1.5       title "MSL=80%" ,\
                 "contention_200/known-ratio-4-16-98-15-3.txt" using  ($1/60):2  every 2 w linespoints  ls 5550 ps 0.75 lw 1.5         title "MSL=98%"

############################################################################################

set title "Minimum number of contention intervals, {/Symbol D}=300" font "Helvetica,17"

set xlabel ""
set ylabel ""
# set ylabel "T [s]" font "Helvetica,19"
set key top left font "Helvetica,16"
plot [0:40][0:140] "contention_300/sys-time-4-16-80-15-300-2.txt" u ($1/60):2 every 2  ls 20   ps 0.35  title "MSL=80%"

set title ""
set key top left font "Helvetica,16"
plot [0:40][0:70] "contention_300/queue-length-4-16-50-15-300-1.txt"  using ($1/60):2 every 2 with lines  ls 20    lw 1.5   title "MSL=50%" ,\
                  "contention_300/queue-length-4-16-80-15-300-2.txt" using  ($1/60):2  every 2 with lines  ls 2200  lw 1.5   title "MSL=80%" ,\
                  "contention_300/queue-length-4-16-98-15-300-3.txt" using  ($1/60):2  every 2 with lines  ls 5550  lw 1.5   title "MSL=98%"

set key bottom right font "Helvetica,16"
set xlabel "Operation time [minutes]" font "Helvetica,19"


plot [0:40][0:1] "contention_300/known-ratio-4-16-50-15-300-1.txt"  using ($1/60):2 every 2 w linespoints  ls 20   ps 0.75 lw 1.5    title "MSL=50%" ,\
                 "contention_300/known-ratio-4-16-80-15-300-2.txt" using  ($1/60):2  every 2 w linespoints  ls 2200 ps 0.75 lw 1.5       title "MSL=80%" ,\
                 "contention_300/known-ratio-4-16-98-15-300-3.txt" using  ($1/60):2  every 2 w linespoints  ls 5550 ps 0.75 lw 1.5  title "MSL=98%"

unset multiplot数据文件是链接的https://www.dropbox.com/sh/2t5x8qeb59ksjgt/AACWUYNdiuTTc7Xt1-gZTBDYa?dl=0。
情节如下:
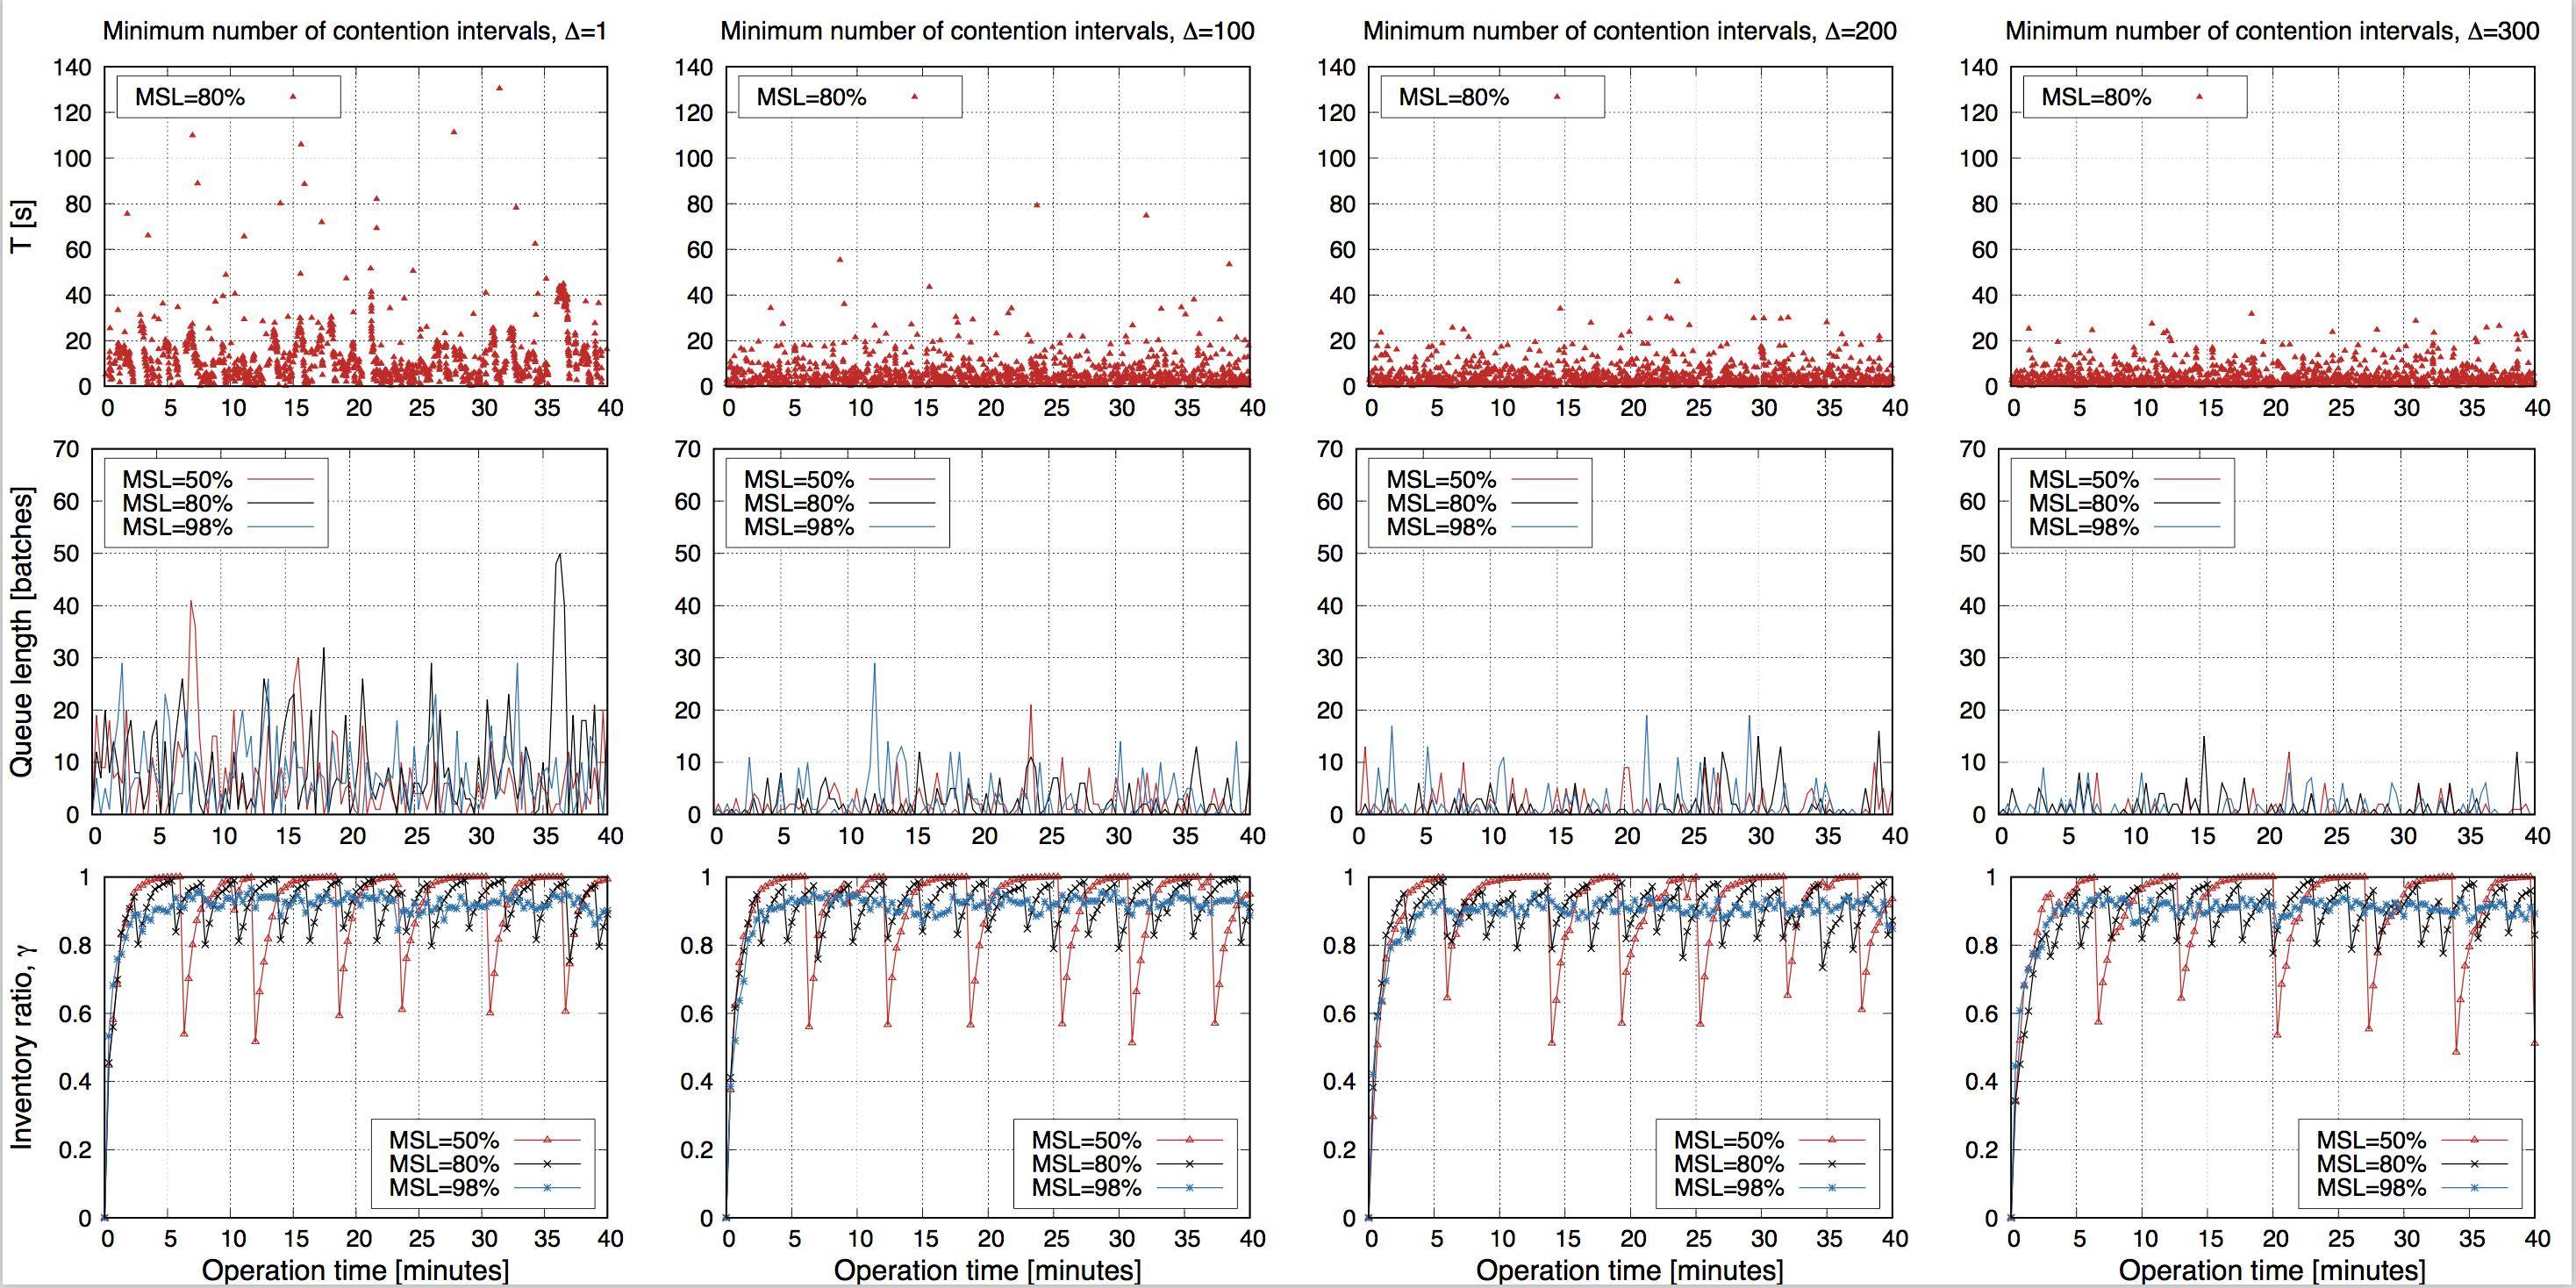
其中有我想要展示的信息。
然而,帧的大小并不相等。例如,第一行较短,因为它有标题,中间一行的情节更大,底部的行也很小。单个地块的宽度也不同。
我在https://www.dropbox.com/sh/2t5x8qeb59ksjgt/AACWUYNdiuTTc7Xt1-gZTBDYa?dl=0的这篇文章中看到,使用set l/b/r/tmargin at screen value是在多点2x2中设置帧大小的方法,但在我的例子中,使用multiplot 3x4和使用抽象组以及单个图之间的分离会导致更难实现。
回答 1
Stack Overflow用户
回答已采纳
发布于 2019-05-30 19:50:44
在我看来,您可能应该忘记set multiplot layout 3,4。相反,自己设置地块的大小和来源,并将标题和xlabels作为标签插入到顶部和底部。然后使用一些参数来调整布局。如果代码可能不够自我解释,请毫不犹豫地问。
代码:
### customized multiplot
reset session
# Parameters to tune
PlotRows = 3
PlotCols = 4
TitlePosY = 0.98
MultiPlotTop = 0.93
SizeScalingX = 0.90
SizeScalingY = 0.95
MultiPlotBottom = 0.05
XLabelPosY = 0.03
MultiPlotLeft = 0.07
YLabelPosX = 0.02
set lmargin 2
# define origin functions
PlotGridX = (1-MultiPlotLeft)/PlotCols
PlotOriginX(n) = ((n-1)%PlotCols)*PlotGridX + MultiPlotLeft
PlotGridY = (MultiPlotTop-MultiPlotBottom)/PlotRows
PlotOriginY(n) = (PlotRows-1-int((n-1)/PlotCols))*PlotGridY + MultiPlotBottom
# set size
set size SizeScalingX*(1-MultiPlotLeft)/PlotCols, SizeScalingY*(MultiPlotTop+MultiPlotBottom)/PlotRows
# set your titles and labels
TitleStd = "Minimum number of \ncontention intervals, {/Symbol D}="
TitleVar = "1 100 200 300"
XLabelStd = "Operation time [minutes]"
do for [i=1:PlotCols] {
set label i at screen PlotOriginX(i), screen TitlePosY TitleStd.word(TitleVar,i) font "Helvetica,8"
set label i+10 at screen PlotOriginX(i), screen XLabelPosY XLabelStd font "Helvetica,8"
}
YLabels = '"T [s]" "Queue length [batches]" "Inventory ratio, {/Symbol g}"'
do for [i=1:PlotRows] {
set label i+20 at screen YLabelPosX, screen PlotOriginY(i*PlotCols)+PlotGridY*0.5 word(YLabels,i) rotate by 90 center
}
set multiplot
do for [i=1:12] { # do your 3x4 plots here and increase "counter" i after each plot
set origin PlotOriginX(i), PlotOriginY(i)
plot 10**((i-1)/4)*sin(0.1*i*x) notitle
}
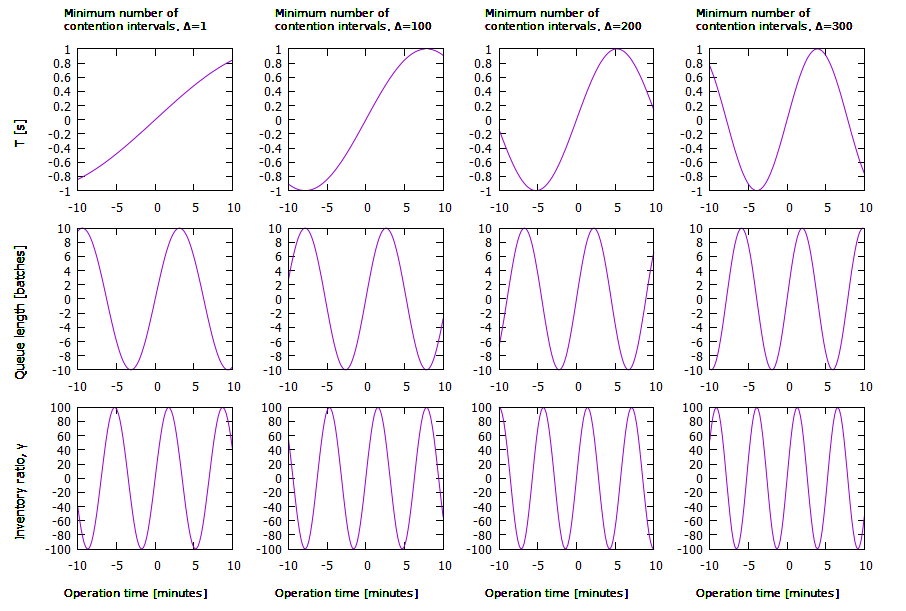
unset multiplot
### end of code结果:
页面原文内容由Stack Overflow提供。腾讯云小微IT领域专用引擎提供翻译支持
原文链接:
https://stackoverflow.com/questions/56381873
复制相关文章
相似问题
腾讯云开发者

Copyright © 2013 - 2026 Tencent Cloud. All Rights Reserved. 腾讯云 版权所有
深圳市腾讯计算机系统有限公司 ICP备案/许可证号:粤B2-20090059 ![]() 粤公网安备44030502008569号
粤公网安备44030502008569号
腾讯云计算(北京)有限责任公司 京ICP证150476号 | 京ICP备11018762号