
带有3个标签的scale_x_discrete 5滴答
带有3个标签的scale_x_discrete 5滴答
提问于 2019-05-24 00:19:29
我有五个条件:
labels = c("Baseline","Passenger Drive","Passenger Drive","Remote Drive","Remote Drive")我想在现有的两点中间加上一个“乘客驾驶”和“远程驾驶”的标签。
玩具数据集:
  df <- data.frame(cbind(cbind(condition = c("Baseline","Passenger Drive",
                        "Passenger Drive","Remote Drive","Remote Drive"),
          rt_type = c("none",rep(c("driver_rt","other_rt"),2))),
  rt = c(.4,.6,.5,.7,.62)))

  ggplot(data = df,aes(x = interaction(rt_type,condition), y = rt)) +
  theme_classic() +
  geom_line(group = 1, size = 1) +
  geom_point(size = 3) +
  scale_x_discrete(labels = c("Baseline",
                              "Passenger Drive",
                              "Remote Drive")) +
  labs(x = "Condition by Speaker", y = "Reaction Time (s)",
       linetype = "Responder", shape = "Speaker")
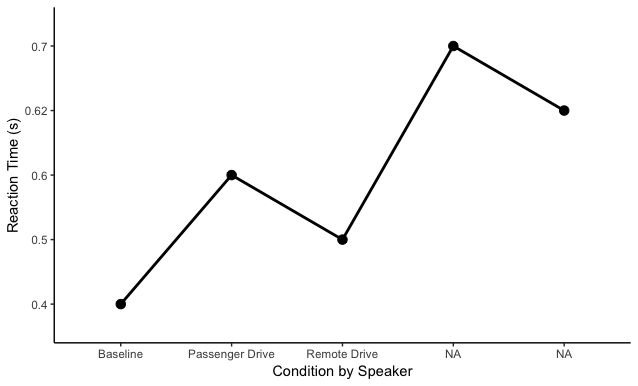
当我尝试使用中断的scale_x_continous时,我会得到一个错误,因为数据是离散的和分类的。实际的dataset有更多的变量表示,所以我不要求一个更有效的方法来绘制这些数据。我只想把5个分类x轴位置的标签转换成3个x轴标签.“乘客车道”将在第2点和第3点之间移动,“远程车道”将在第4点和第5点之间移动。
回答 2
Stack Overflow用户
回答已采纳
发布于 2019-05-24 03:48:03
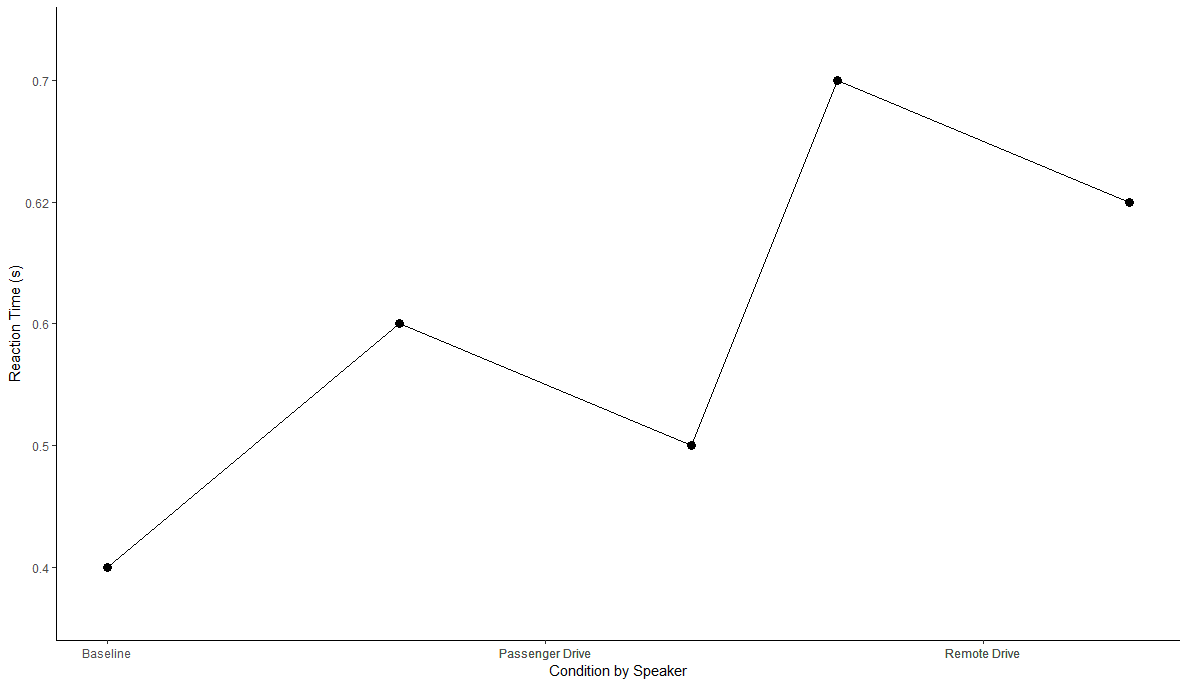
您可以为x轴创建虚拟数值变量,并使用scale_x_continuous而不是scale_x_discrete。
# This replaces interaction(rt_type, condition)
df$intr <- as.numeric(as.factor(interaction(df$rt_type, df$condition)))

# Creating dummy mid point to place labels in the middle
ref_avg <- aggregate(intr ~ condition, df, mean)
df$my_breaks <- ref_avg[match(df$condition, ref_avg$condition), "intr"]

ggplot(data = df,aes(x = intr, y = rt)) +
  theme_classic() +
  geom_point(size = 3)  +
  geom_path(group = 1) +
  scale_x_continuous(breaks = df$my_breaks, labels = df$condition) +
  labs(x = "Condition by Speaker", y = "Reaction Time (s)",
       linetype = "Responder", shape = "Speaker")
Stack Overflow用户
发布于 2019-05-24 03:42:48
解决办法
简单地改变
  scale_x_discrete(labels = c("Baseline",
                              "Passenger Drive",
                              "Remote Drive")) +
至
scale_x_discrete(labels = df$condition) +可取的
我知道你没有要求一个更有效的方法,但我认为只有一个变量(前)。rt_type)应该映射到点形状。
ggplot(data = df, aes(x = condition, y = rt, shape = rt_type)) +
  theme_classic() +
  geom_point(size = 3,) +
  scale_x_discrete(labels = c("Baseline",
                              "Passenger Drive",
                              "Remote Drive")) +
  labs(
    x = "Condition by Speaker",
    y = "Reaction Time (s)"
)页面原文内容由Stack Overflow提供。腾讯云小微IT领域专用引擎提供翻译支持
原文链接:
https://stackoverflow.com/questions/56284398
复制相关文章
相似问题
腾讯云开发者

Copyright © 2013 - 2026 Tencent Cloud. All Rights Reserved. 腾讯云 版权所有
深圳市腾讯计算机系统有限公司 ICP备案/许可证号:粤B2-20090059 ![]() 粤公网安备44030502008569号
粤公网安备44030502008569号
腾讯云计算(北京)有限责任公司 京ICP证150476号 | 京ICP备11018762号