
向循环中的轴添加补丁将返回一个ValueError
向循环中的轴添加补丁将返回一个ValueError
提问于 2019-05-21 08:35:51
因此,我有一个for循环,在图形的子图中绘制生物图。我正在使用这进行子图安排。下面是我的代码摘录:
import matplotlib.pyplot as plt
from matplotlib.patches import Circle
from matplotlib.collections import PatchCollection
import numpy as np
from grid_strategy import strategies
from shapely.geometry import MultiLineString
from descartes.patch import PolygonPatch


fig = plt.figure()
space = [
    Circle((2, 2), radius=5, color='red',  alpha=np.random.uniform(0, 1)),
    Circle((-2, 2), radius=5, color='red',  alpha=np.random.uniform(0, 1)),
    Circle((2, -2), radius=5, color='red',  alpha=np.random.uniform(0, 1)),
]

lines = [
    [
        [0.0, 0.0],
        [0.007963267107332634, 9.999996829318349],
        [-9.992024050168064, 10.015923358483217]
    ],
    [
        [-9.992024050168064, 10.015923358483217],
        [-5.547622120022902, 3.3640595983538804],
        [-2.7450196155284288, 10.857084301489543]
    ],
    [
        [-2.7450196155284288, 10.857084301489543],
        [-8.83003187757613, 8.873999388852386]
    ],
    [
        [-2.7450196155284288, 10.857084301489543],
        [-1.1168525035132877, 0.9905209760275202]
    ],
    [
        [-9.992024050168064, 10.015923358483217],
        [-4.576474350758081, 15.904201668245792],
        [-9.381605405732934, 9.508053175245003]
    ],
    [
        [-9.381605405732934, 9.508053175245003],
        [-9.348197751236784, 15.907965981574565]
    ],
    [
        [-9.381605405732934, 9.508053175245003],
        [-15.091199417814586, 1.2982702172611962]
    ]
]

creature = MultiLineString(lines)

creature_patch = PolygonPatch(creature.buffer(5))

plot_spec = strategies.SquareStrategy('center').get_grid(2)

for _, sub in zip(range(2), plot_spec):
    ax = fig.add_subplot(sub)

    for line in creature:
        x, y = line.xy
        ax.plot(x, y, 'r-')

    ax.add_patch(creature_patch)
    for p in space:
        ax.add_patch(p)

ax.get_xaxis().set_visible(False)
ax.get_yaxis().set_visible(False)
ax.autoscale(axis='y')
ax.axis('equal')
plt.show()对于For循环的单个迭代,工作并输出以下内容:
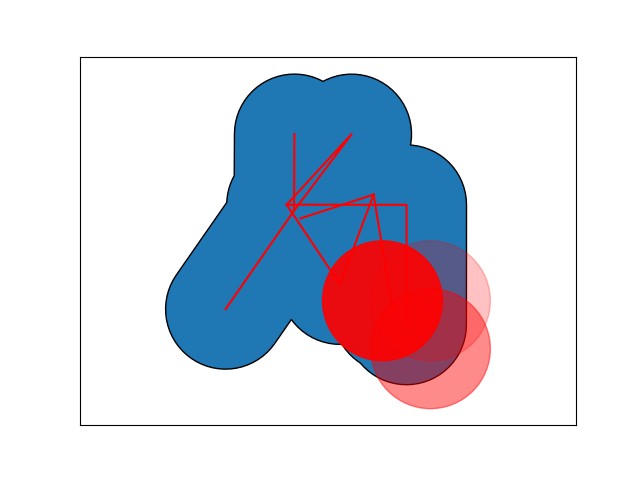
Where:
for line in creature:是红线
ax.add_patch(creature_patch)是蓝色的斑点
for p in space:是红色的圆
然而,只要我想要绘制多个子图,我就会得到以下错误:
  File "c:\Users\Zack\Google Drive\Studies\Meesters\Meesters\New Direction (L-Systems)\New-Direction-L-Systems-\Versions\tools\render.py", line 109, in genDraw
    ax.add_patch(p)
  File "C:\ProgramData\Anaconda3\lib\site-packages\matplotlib\axes\_base.py", line 1967, in add_patch
    self._set_artist_props(p)
  File "C:\ProgramData\Anaconda3\lib\site-packages\matplotlib\axes\_base.py", line 926, in _set_artist_props
    a.axes = self
  File "C:\ProgramData\Anaconda3\lib\site-packages\matplotlib\artist.py", line 209, in axes
    raise ValueError("Can not reset the axes.  You are probably "
ValueError: Can not reset the axes. You are probably trying to re-use an artist in more than one Axes which is not supported 我不明白这一点,因为ax变量在每次迭代时都被设置为不同的Axes对象。
谢谢你的帮助
回答 1
Stack Overflow用户
回答已采纳
发布于 2019-05-21 14:43:07
正如已经注释过的那样,space包含几个补丁。一旦将它们添加到一个轴上,就不能将它们添加到另一个轴上。这就是错误告诉你的。
解决方案是在每个轴上创建一组补丁,例如:
import matplotlib.pyplot as plt
from matplotlib.patches import Circle
import numpy as np


fig = plt.figure()

def get_space():
    space = [
        Circle((2, 2), radius=5, color='red',  alpha=np.random.uniform(0, 1)),
        Circle((-2, 2), radius=5, color='red',  alpha=np.random.uniform(0, 1)),
        Circle((2, -2), radius=5, color='red',  alpha=np.random.uniform(0, 1)),
    ]
    return space


plot_spec = fig.add_gridspec(1,2)

for _, sub in zip(range(2), plot_spec):
    ax = fig.add_subplot(sub)

    for p in get_space():
        ax.add_patch(p)

    ax.get_xaxis().set_visible(False)
    ax.get_yaxis().set_visible(False)
    ax.autoscale(axis='y')
    ax.axis('equal')
plt.show()页面原文内容由Stack Overflow提供。腾讯云小微IT领域专用引擎提供翻译支持
原文链接:
https://stackoverflow.com/questions/56234296
复制相关文章
相似问题
腾讯云开发者

Copyright © 2013 - 2026 Tencent Cloud. All Rights Reserved. 腾讯云 版权所有
深圳市腾讯计算机系统有限公司 ICP备案/许可证号:粤B2-20090059 ![]() 粤公网安备44030502008569号
粤公网安备44030502008569号
腾讯云计算(北京)有限责任公司 京ICP证150476号 | 京ICP备11018762号