
如何在数据资源管理器的plot_missing()函数中更改颜色和带标
如果其他人试图自定义DataExplorer的plot_missing()函数中的颜色并对乐队标签进行硬编码,那么下面是一个简单的方法。
默认输出
# To show all bands I've replaced `species` column in the `starwars` dataset with NA
data(starwars)
df <- starwars
df$species <- NA

library(DataExplorer)
plot_missing(df)
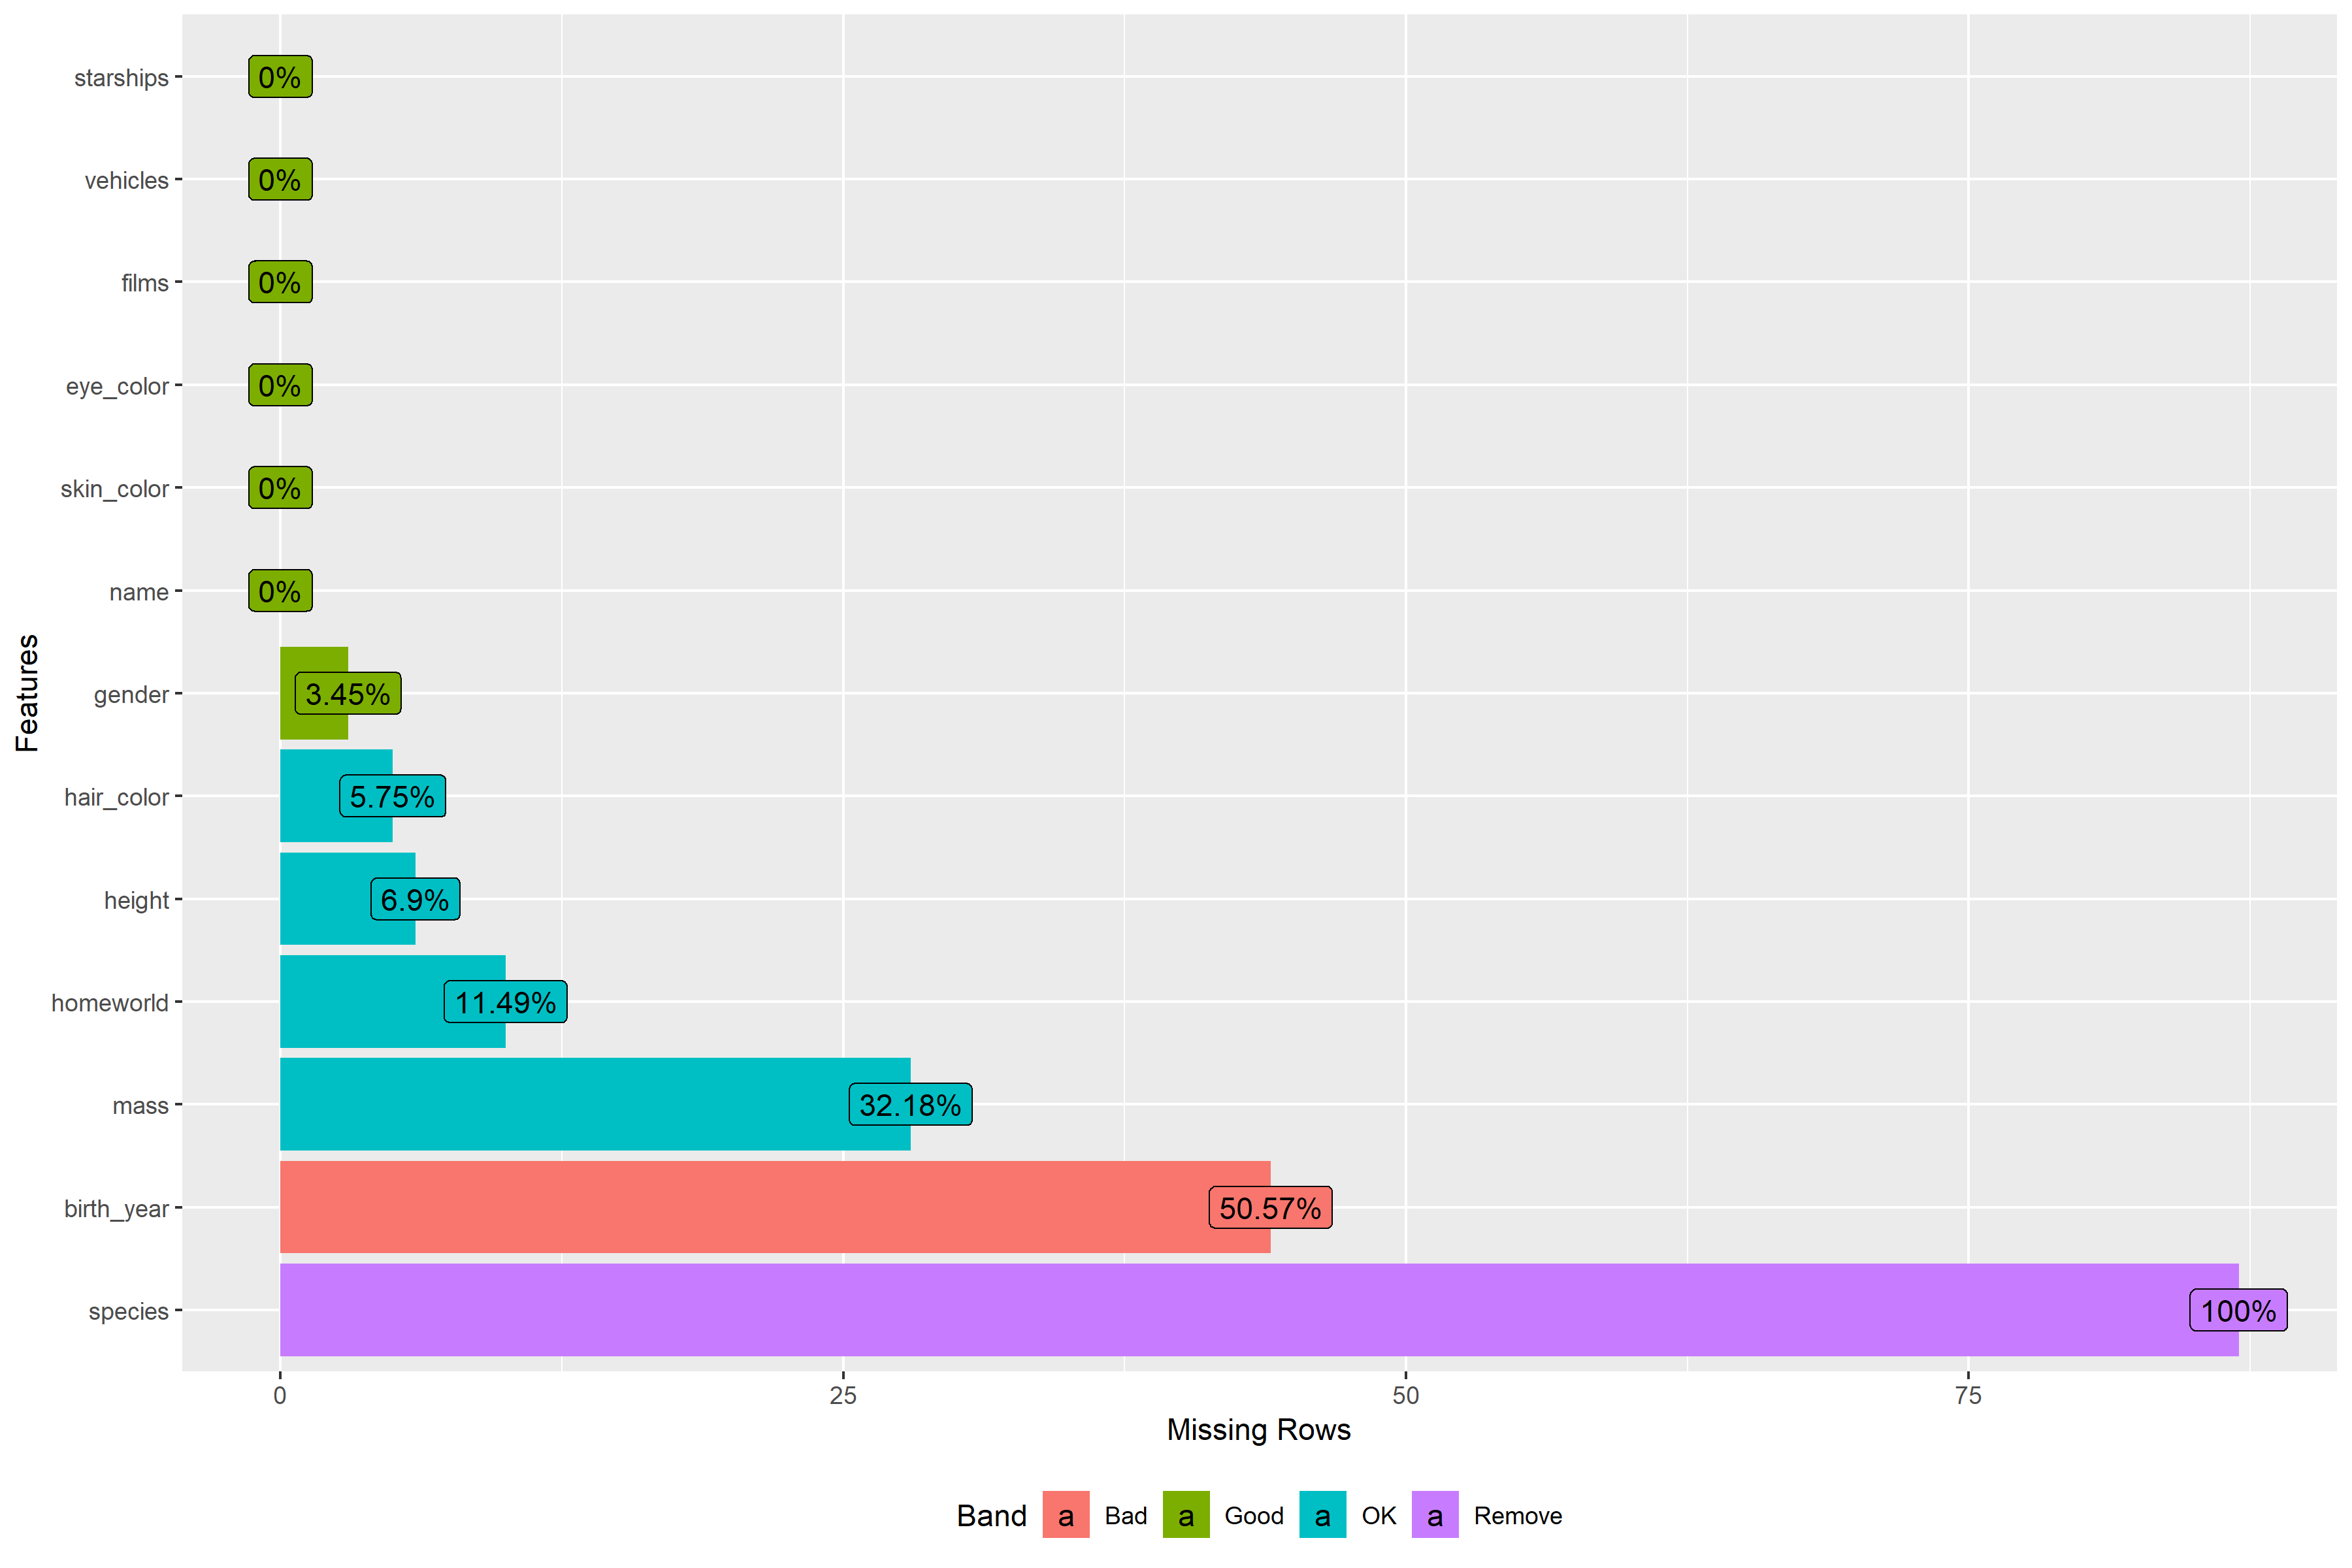
正如您所看到的,得到的图形有按字母顺序排列的乐队标签“不好,移除”,这与协调颜色不太好。例如。“删除”颜色是紫色的,当它是最有意义的红色(由于ggplot2的默认颜色正在使用)。
回答 1
Stack Overflow用户
发布于 2019-05-01 19:00:56
为了使输出plot_missing更清晰,您可以更改plot_missing()的根函数并将其赋值给另一个变量(plot_missing_2)。
# Original function
function (data, group = list(Good = 0.05, OK = 0.4, Bad = 0.8,
  Remove = 1), geom_label_args = list(), title = NULL, ggtheme = theme_gray(),
theme_config = list(legend.position = c("bottom")))
{
  pct_missing <- Band <- NULL
  missing_value <- data.table(profile_missing(data))
  group <- group[sort.list(unlist(group))]
  invisible(lapply(seq_along(group), function(i) {
    if (i == 1) {
      missing_value[pct_missing <= group[[i]], `:=`(Band,
        names(group)[i])]
    } else {
      missing_value[pct_missing > group[[i - 1]] & pct_missing <=
         group[[i]], `:=`(Band, names(group)[i])]
    }
}))
  output <- ggplot(missing_value, aes_string(x = "feature",
    y = "num_missing", fill = "Band")) + geom_bar(stat = "identity") +
    scale_fill_discrete("Band") + coord_flip() + xlab("Features") +
    ylab("Missing Rows")
  geom_label_args_list <- list(mapping = aes(label = paste0(round(100 *
    pct_missing, 2), "%")))
  output <- output + do.call("geom_label", c(geom_label_args_list,
    geom_label_args))
  class(output) <- c("single", class(output))
  plotDataExplorer(plot_obj = output, title = title, ggtheme = ggtheme,
    theme_config = theme_config)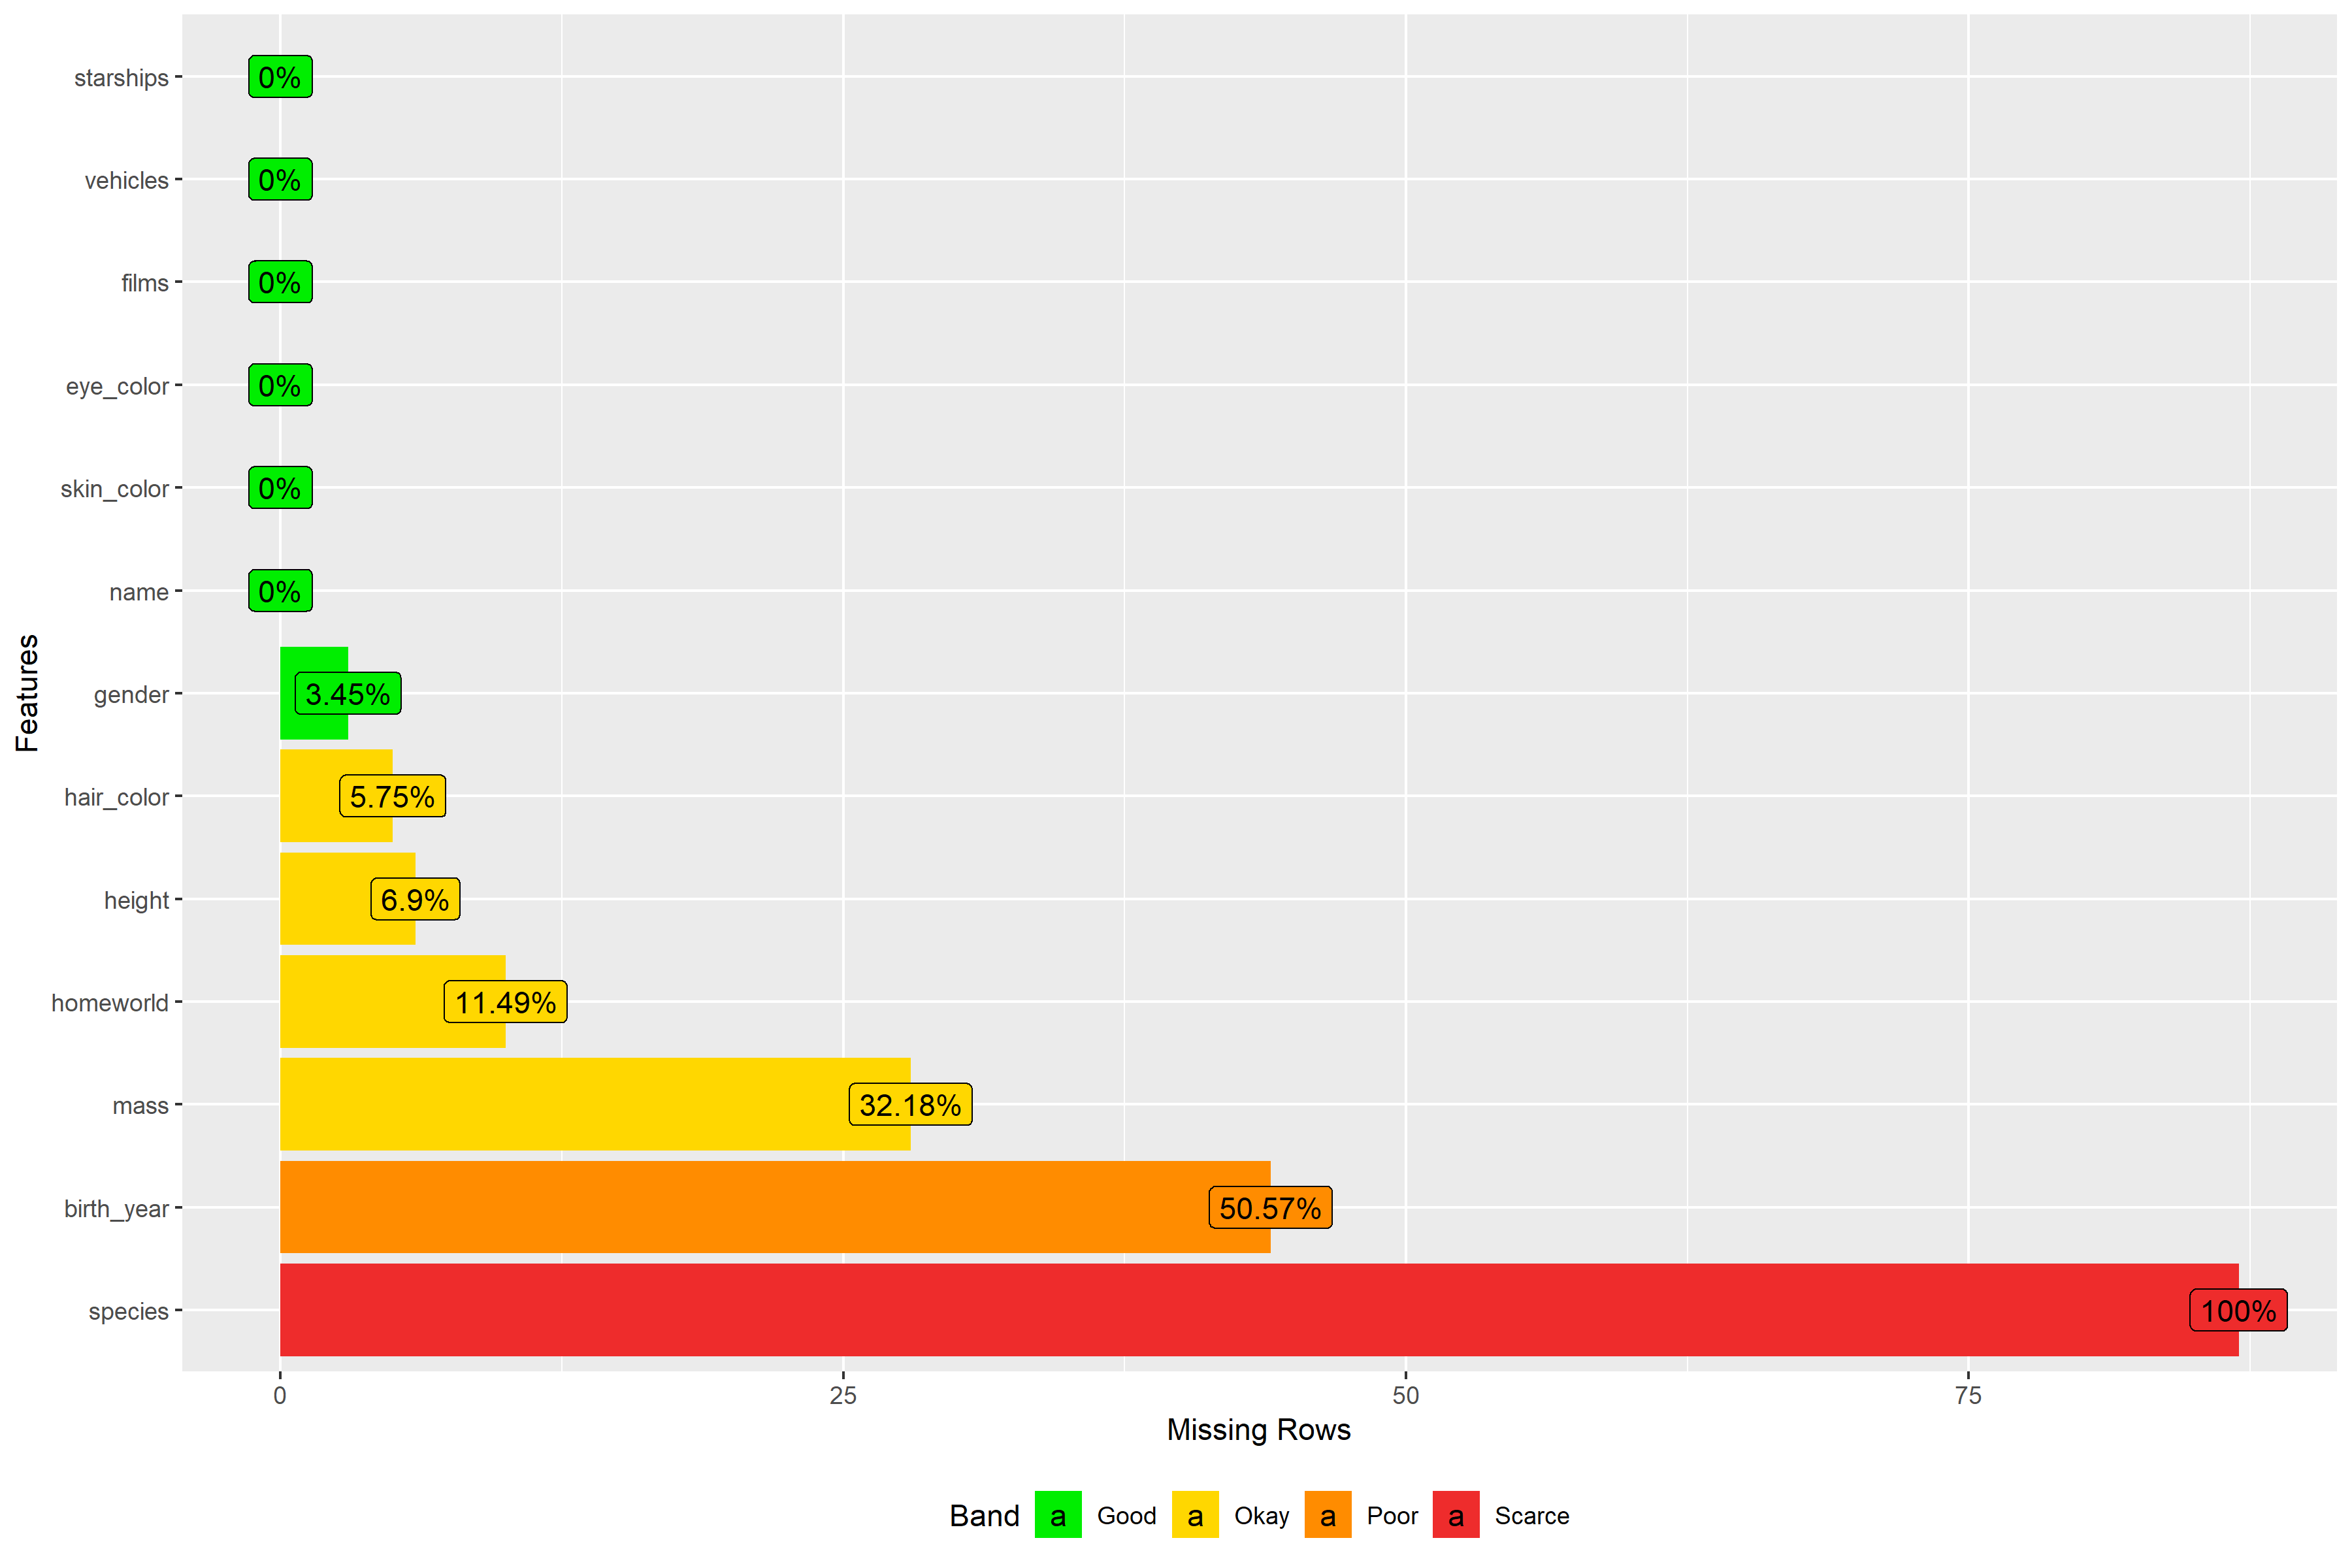
}主要是将group = list(Good = 0.05, OK = 0.4, Bad = 0.8, Remove = 1)改为group = list(Good = 0.05, Okay = 0.4, Poor = 0.8, Scarce = 1),将scale_fill_discrete("Band")更改为scale_fill_manual("Band", values = c("Good"="green2","Okay"="gold","Poor"="darkorange","Scarce"="firebrick2"))。您可以根据自己的喜好设置自己的组,只需记住所显示的乐队的顺序是按字母顺序排列的(还没有对此进行修改)。您也可以将颜色更改为您喜欢的任何颜色。只需记住将plot_missing()函数赋值给一个新变量,例如plot_missing_2。
定制函数
# Custom function
plot_missing_2 <-
function (data, group = list(Good = 0.05, Okay = 0.4, Poor = 0.8,
  Scarce =  1), geom_label_args = list(), title = NULL, ggtheme = theme_gray(),
theme_config = list(legend.position = c("bottom")))
{
  pct_missing <- Band <- NULL
  missing_value <- data.table(profile_missing(data))
  group <- group[sort.list(unlist(group))]
  invisible(lapply(seq_along(group), function(i) {
    if (i == 1) {
      missing_value[pct_missing <= group[[i]], `:=`(Band,
         names(group)[i])]
    } else {
  missing_value[pct_missing > group[[i - 1]] & pct_missing <=
     group[[i]], `:=`(Band, names(group)[i])]
    }
}))
  output <- ggplot(missing_value, aes_string(x = "feature",
    y = "num_missing", fill = "Band")) + geom_bar(stat = "identity") +
   scale_fill_manual("Band", values = c("Good"="green2","Okay"="gold","Poor"="darkorange","Scarce"="firebrick2")) + coord_flip() + xlab("Features") +
   ylab("Missing Rows")
  geom_label_args_list <- list(mapping = aes(label = paste0(round(100 *
    pct_missing, 2), "%")))
  output <- output + do.call("geom_label", c(geom_label_args_list,
     geom_label_args))
  class(output) <- c("single", class(output))
  plotDataExplorer(plot_obj = output, title = title, ggtheme = ggtheme,
   theme_config = theme_config)
}
自定义输出
data(starwars)
df <- starwars
df$species <- NA

library(DataExplorer)
plot_missing_2(df)
https://stackoverflow.com/questions/55941265
复制相似问题
腾讯云开发者

Copyright © 2013 - 2026 Tencent Cloud. All Rights Reserved. 腾讯云 版权所有
深圳市腾讯计算机系统有限公司 ICP备案/许可证号:粤B2-20090059 ![]() 粤公网安备44030502008569号
粤公网安备44030502008569号
腾讯云计算(北京)有限责任公司 京ICP证150476号 | 京ICP备11018762号